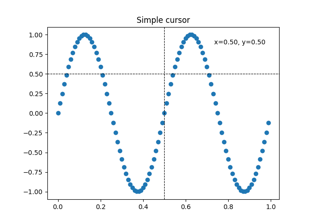
matplotlib.axes.Axes.axhline#
- Axes.axhline(y=0, xmin=0, xmax=1, **kwargs)[源码]#
添加一条水平线,跨越 Axes 的全部或部分。
注意:如果想在数据坐标中设置x轴范围,请使用
hlines代替。- 参数:
- 返回:
- 其他参数:
- **kwargs
有效的关键字参数是
Line2D的属性,除了 'transform'属性
描述
一个过滤函数,它接受一个 (m, n, 3) 浮点数组和一个 dpi 值,并返回一个 (m, n, 3) 数组以及图像左下角的两个偏移量
浮点数或 None
布尔值
布尔值
BboxBase或 None布尔值
Patch 或 (Path, Transform) 或 None
CapStyle或 {'butt', 'projecting', 'round'}JoinStyle或 {'miter', 'round', 'bevel'}浮点数序列(点中的开/关墨迹)或 (None, None)
(2, N) 数组或两个一维数组
{'default', 'steps', 'steps-pre', 'steps-mid', 'steps-post'},默认值: 'default'
{'full', 'left', 'right', 'bottom', 'top', 'none'}
颜色 或 None
字符串
布尔值
对象
{'-', '--', '-.', ':', '', (offset, on-off-seq), ...}
浮点数
marker style string,
Path或MarkerStyle浮点数
markersize或ms浮点数
None 或 int 或 (int, int) 或 slice 或 list[int] 或 float 或 (float, float) 或 list[bool]
布尔值
浮点数或 callable[[Artist, Event], tuple[bool, dict]]
浮点数
布尔值
(scale: 浮点数, length: 浮点数, randomness: 浮点数)
布尔值或 None
CapStyle或 {'butt', 'projecting', 'round'}JoinStyle或 {'miter', 'round', 'bevel'}未知
字符串
布尔值
一维数组
一维数组
浮点数
示例
在 'y' = 0 处绘制一条横跨x轴范围的粗红色水平线
>>> axhline(linewidth=4, color='r')
在 'y' = 1 处绘制一条横跨x轴范围的默认水平线
>>> axhline(y=1)
在 'y' = 0.5 处绘制一条横跨x轴范围中间一半的默认水平线
>>> axhline(y=.5, xmin=0.25, xmax=0.75)