matplotlib.axes.Axes.inset_axes#
- Axes.inset_axes(bounds, *, transform=None, zorder=5, **kwargs)[源]#
将子插入式 Axes 添加到此现有 Axes。
- 参数:
- bounds[x0, y0, width, height]
插入式 Axes 的左下角及其宽度和高度。
- transform
Transform 默认为
ax.transAxes,即 *rect* 的单位是 Axes 相对坐标。- projection{None, 'aitoff', 'hammer', 'lambert', 'mollweide', 'polar', 'rectilinear', str}, 可选
插入式
Axes的投影类型。*str* 是自定义投影的名称,请参阅projections。默认值为 None 会生成“直角坐标”投影。- polarbool, 默认值: False
如果为 True,相当于 projection='polar'。
- axes_class
Axes的子类类型,可选 被实例化的
axes.Axes子类。此参数与 projection 和 polar 不兼容。请参阅 axisartist 获取示例。- zorder数字
默认为 5(与
Axes.legend相同)。调整高低以更改其是在父 Axes 上方还是下方绘制数据。- **kwargs
其他关键字参数会传递给插入式 Axes 类。
- 返回:
- ax
创建的
Axes实例。
示例
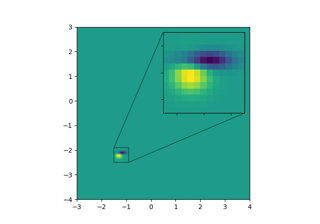
此示例创建两个插入式 Axes,第一个使用 Axes 相对坐标,第二个使用数据坐标。
fig, ax = plt.subplots()
ax.plot(range(10))
axin1 = ax.inset_axes([0.8, 0.1, 0.15, 0.15])
axin2 = ax.inset_axes(
        [5, 7, 2.3, 2.3], transform=ax.transData)