matplotlib.figure.Figure.add_axes#
- Figure.add_axes(*args, **kwargs)[源代码]#
将一个
Axes添加到图中。调用签名
add_axes(rect, projection=None, polar=False, **kwargs)
add_axes(ax)
- 参数:
- rect元组 (left, bottom, width, height)
新的
Axes的尺寸(左、下、宽、高)。所有量都以图的宽度和高度的分数表示。- projection{None, 'aitoff', 'hammer', 'lambert', 'mollweide', 'polar', 'rectilinear', str}, 可选
Axes的投影类型。str 是自定义投影的名称,详见projections。默认 None 会生成一个 'rectilinear' 投影。- polarbool, 默认值: False
如果为 True,相当于 projection='polar'。
- axes_class
Axes的子类类型,可选 被实例化的
axes.Axes子类。此参数与 projection 和 polar 不兼容。有关示例,请参阅 axisartist。- sharex, sharey
Axes,可选 与 sharex 和/或 sharey 共享 x 轴或 y 轴。该轴将与共享 Axes 的轴具有相同的限制、刻度和比例。
- labelstr
返回的 Axes 的标签。
- 返回:
Axes,或Axes的子类返回的 Axes 类取决于所使用的投影。如果使用直角投影,则为
Axes;如果使用极坐标投影,则为projections.polar.PolarAxes。
- 其他参数:
- **kwargs
此方法还接受返回的 Axes 类的关键字参数。直角坐标系 Axes 类
Axes的关键字参数可在下表中找到,但如果使用其他投影,可能还有其他关键字参数,请参阅实际的 Axes 类。属性
描述
{'box', 'datalim'}
一个过滤函数,它接受一个 (m, n, 3) 浮点数组和一个 dpi 值,并返回一个 (m, n, 3) 数组以及图像左下角的两个偏移量
浮点数或 None
(float, float) 或 {'C', 'SW', 'S', 'SE', 'E', 'NE', ...}
布尔值
{'auto', 'equal'} 或 float
布尔值
未知
未知
Callable[[Axes, Renderer], Bbox]
布尔值 或 'line'
浮点数或 None
BboxBase或 None布尔值
Patch 或 (Path, Transform) 或 None
bool 或 "auto"
布尔值
str
布尔值
object
布尔值
布尔值
未知
None 或 布尔值 或 浮点数 或 可调用对象
[left, bottom, width, height] 或
Bbox浮点数或 None
布尔值
(scale: 浮点数, length: 浮点数, randomness: 浮点数)
布尔值或 None
未知
str
str
布尔值
(lower: float, upper: float)
str
(left: float, right: float)
float 大于 -0.5
未知
未知
未知
(lower: float, upper: float)
str
(bottom: float, top: float)
float 大于 -0.5
未知
未知
未知
浮点数
备注
在极少数情况下,
add_axes可能会在仅传递一个参数的情况下被调用,该参数是已在当前图中创建但不在图的 Axes 列表中的 Axes 实例。示例
一些简单的例子
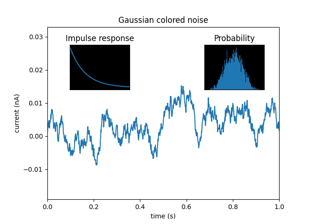
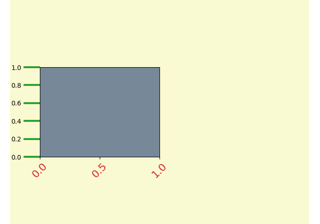
rect = l, b, w, h
fig = plt.figure()
fig.add_axes(rect)
fig.add_axes(rect, frameon=False, facecolor='g')
fig.add_axes(rect, polar=True)
ax = fig.add_axes(rect, projection='polar')
fig.delaxes(ax)
fig.add_axes(ax)