matplotlib.pyplot.subplot#
- matplotlib.pyplot.subplot(*args, **kwargs)[源码]#
添加一个 Axes 到当前图表或检索一个已存在的 Axes。
这是
Figure.add_subplot的一个封装,它在处理隐式 API 时提供额外的行为(参见注释部分)。调用签名
subplot(nrows, ncols, index, **kwargs)
subplot(pos, **kwargs)
subplot(**kwargs)
subplot(ax)
- 参数:
- *argsint, (int, int, index), 或
SubplotSpec, 默认: (1, 1, 1) 由以下之一描述的子图位置
三个整数(nrows, ncols, index)。子图将占据一个 nrows 行 ncols 列网格上的 index 位置。index 从左上角开始,编号为 1,然后向右递增。index 也可以是一个双元组,指定子图的(first, last)索引(1-based,包含 last),例如,
fig.add_subplot(3, 1, (1, 2))会创建一个跨越图表顶部 2/3 的子图。一个三位整数。这些数字被解释为三个单独的单数字整数,即
fig.add_subplot(235)与fig.add_subplot(2, 3, 5)相同。请注意,这仅在子图数量不超过 9 个时才能使用。一个
SubplotSpec。
- projection{None, 'aitoff', 'hammer', 'lambert', 'mollweide', 'polar', 'rectilinear', str}, 可选
子图的投影类型 (
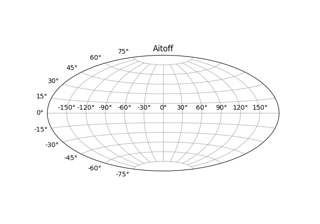
Axes)。str 是自定义投影的名称,详见projections。默认值 None 会生成一个“rectilinear”(直角坐标系)投影。- polarbool, 默认值: False
如果为 True,相当于 projection='polar'。
- sharex, sharey
Axes, 可选 与 sharex 和/或 sharey 共享 x 或 y
轴。该轴将与共享 Axes 的轴具有相同的限制、刻度线和比例。- labelstr
返回的 Axes 的标签。
- *argsint, (int, int, index), 或
- 返回:
Axes子图的 Axes。返回的 Axes 实际上可以是子类的实例,例如极坐标投影的
projections.polar.PolarAxes。
- 其他参数:
- **kwargs
此方法还接受返回的 Axes 基类的关键字参数;除了 figure 参数。直角坐标系基类
Axes的关键字参数可在下表中找到,但如果使用其他投影,也可能存在其他关键字参数。属性
描述
{'box', 'datalim'}
一个过滤函数,它接受一个 (m, n, 3) 浮点数组和一个 dpi 值,并返回一个 (m, n, 3) 数组以及图像左下角的两个偏移量
浮点数或 None
(float, float) 或 {'C', 'SW', 'S', 'SE', 'E', 'NE', ...}
布尔值
{'auto', 'equal'} 或 float
布尔值
未知
未知
Callable[[Axes, Renderer], Bbox]
布尔值 或 'line'
浮点数或 None
BboxBase或 None布尔值
Patch 或 (Path, Transform) 或 None
bool 或 "auto"
布尔值
str
布尔值
object
布尔值
布尔值
未知
list of
AbstractPathEffectNone 或 布尔值 或 浮点数 或 可调用对象
[left, bottom, width, height] 或
Bbox浮点数或 None
布尔值
(scale: 浮点数, length: 浮点数, randomness: 浮点数)
布尔值或 None
未知
str
str
布尔值
(lower: float, upper: float)
str
(left: float, right: float)
float 大于 -0.5
未知
未知
未知
(lower: float, upper: float)
str
(bottom: float, top: float)
float 大于 -0.5
未知
未知
未知
浮点数
备注
3.8 版本发生变化: 在 3.8 版本之前,任何与新 Axes 重叠(超出共享边界)的 Axes 都会被删除。在更新的版本中,不再发生删除。如果需要,请显式使用
Axes.remove。如果您不希望这种行为,请改用
Figure.add_subplot方法或pyplot.axes函数。如果没有传递 kwargs,并且在 args 指定的位置已存在一个 Axes,则会返回该 Axes 而不是创建新的 Axes。
如果传递了 kwargs,并且在 args 指定的位置存在一个 Axes,且投影类型相同,并且 kwargs 与现有 Axes 匹配,则返回现有 Axes。否则,将使用指定参数创建一个新的 Axes。我们保存了用于比较的 kwargs 的引用。如果 kwargs 中的任何值是可变的,我们将无法检测到它们被修改的情况。在这种情况下,我们建议使用
Figure.add_subplot和显式 Axes API,而不是隐式 pyplot API。示例
plt.subplot(221)

# equivalent but more general
ax1 = plt.subplot(2, 2, 1)

# add a subplot with no frame
ax2 = plt.subplot(222, frameon=False)

# add a polar subplot
plt.subplot(223, projection='polar')

# add a red subplot that shares the x-axis with ax1
plt.subplot(224, sharex=ax1, facecolor='red')

# delete ax2 from the figure
plt.delaxes(ax2)

# add ax2 to the figure again
plt.subplot(ax2)

# make the first Axes "current" again
plt.subplot(221)