matplotlib.gridspec.GridSpecBase#
- class matplotlib.gridspec.GridSpecBase(nrows, ncols, height_ratios=None, width_ratios=None)[source]#
基类:
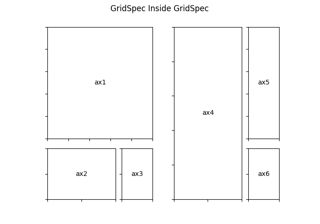
objectGridSpec的基类,用于指定子图将放置的网格的几何形状。
- 参数:
- nrows, ncolsint
网格的行数和列数。
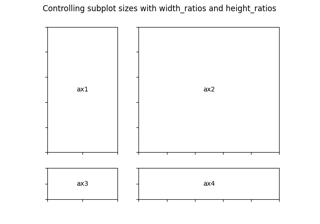
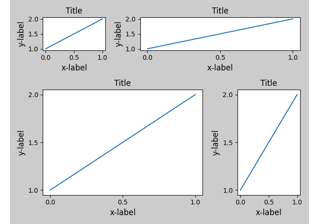
- width_ratios长度为 ncols 的类数组,可选
定义列的相对宽度。每列的相对宽度为
width_ratios[i] / sum(width_ratios)。如果未给出,所有列将具有相同的宽度。- height_ratios长度为 nrows 的类数组,可选
定义行的相对高度。每行的相对高度为
height_ratios[i] / sum(height_ratios)。如果未给出,所有行将具有相同的高度。
- get_grid_positions(fig)[source]#
以图表坐标返回网格单元格的位置。
- 参数:
- fig
Figure 应用网格的图表。子图参数(子图之间的边距和间距)取自 fig。
- fig
- 返回:
- bottoms, tops, lefts, rightsarray
网格单元格在图表坐标中的底部、顶部、左侧、右侧位置。
- property ncols#
网格中的列数。
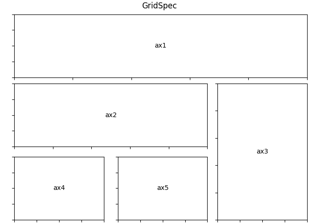
- new_subplotspec(loc, rowspan=1, colspan=1)[source]#
创建并返回一个
SubplotSpec实例。- 参数:
- loc(int, int)
子图在网格中的位置,格式为
(row_index, column_index)。- rowspan, colspanint, default: 1
子图在网格中应跨越的行数和列数。
- property nrows#
网格中的行数。
- set_height_ratios(height_ratios)[source]#
设置行的相对高度。
height_ratios 的长度必须等于 nrows。每行的相对高度为
height_ratios[i] / sum(height_ratios)。
- set_width_ratios(width_ratios)[source]#
设置列的相对宽度。
width_ratios 的长度必须等于 ncols。每列的相对宽度为
width_ratios[i] / sum(width_ratios)。
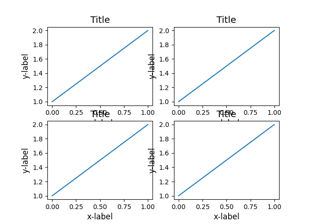
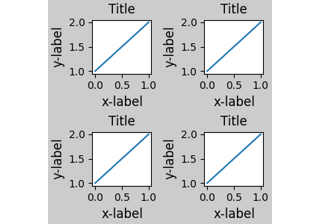
- subplots(*, sharex=False, sharey=False, squeeze=True, subplot_kw=None)[source]#
将此
GridSpec指定的所有子图添加到其父图表。有关详细文档,请参阅
Figure.subplots。