matplotlib.pyplot.suptitle#
- matplotlib.pyplot.suptitle(t, **kwargs)[源]#
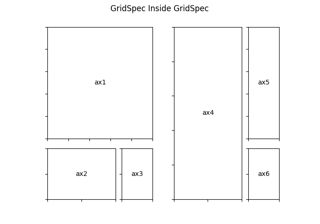
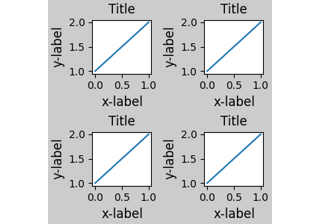
向图形添加一个居中的总标题。
- 参数:
- tstr
主标题文本。
- xfloat, 默认值: 0.5
文本在图表坐标系中的X位置。
- yfloat, 默认值: 0.98
文本在图表坐标系中的Y位置。
- horizontalalignment, ha{'居中', '左对齐', '右对齐'}, 默认值: 居中
文本相对于 (x, y) 的水平对齐方式。
- verticalalignment, va{'top', 'center', 'bottom', 'baseline'}, 默认值: top
文本相对于 (x, y) 的垂直对齐方式。
- fontsize, size默认值:
rcParams["figure.titlesize"](默认值:'large') 文本的字体大小。请参阅
Text.set_size以获取可能的值。- fontweight, weight默认值:
rcParams["figure.titleweight"](默认值:'normal') 文本的字体粗细。请参阅
Text.set_weight以获取可能的值。
- 返回:
- 文本
主标题的
Text实例。
- 其他参数:
- fontpropertiesNone 或 dict, 可选
一个字体属性字典。如果提供了fontproperties,字体大小和粗细的默认值将从
FontProperties的默认值中获取。rcParams["figure.titlesize"](默认值:'large') 和rcParams["figure.titleweight"](默认值:'normal') 在这种情况下将被忽略。- **kwargs
其他 kwargs 是
matplotlib.text.Text属性。
备注
注意