Matplotlib 应用程序接口 (APIs)#
Matplotlib 拥有两种主要的应用程序接口,或者说使用库的方式
一种显式的“Axes”接口,它使用 Figure 或 Axes 对象上的方法来创建其他 Artist,并逐步构建可视化。这种接口也被称为“面向对象”接口。
一种隐式的“pyplot”接口,它跟踪最后创建的 Figure 和 Axes,并将 Artist 添加到它认为用户想要的对象上。
此外,许多下游库(如 pandas 和 xarray)在其数据类上直接提供了 plot 方法,以便用户可以调用 data.plot()。
这些接口之间的差异可能有点令人困惑,尤其是考虑到网络上有些代码片段会使用其中一种,或者在同一个示例中同时使用多种接口。在这里,我们将尝试指出“pyplot”接口和下游接口与显式“Axes”接口之间的关系,以帮助用户更好地使用该库。
Matplotlib 原生接口#
显式“Axes”接口#
“Axes”接口是 Matplotlib 的实现方式,许多自定义和微调最终都是在此级别完成的。
此接口的工作方式是实例化一个 Figure 类的实例(下文中的 fig),在该对象上使用 subplots 方法(或类似方法)来创建一个或多个 Axes 对象(下文中的 ax),然后调用 Axes 上的绘图方法(本示例中的 plot)。
import matplotlib.pyplot as plt

fig = plt.figure()
ax = fig.subplots()
ax.plot([1, 2, 3, 4], [0, 0.5, 1, 0.2])
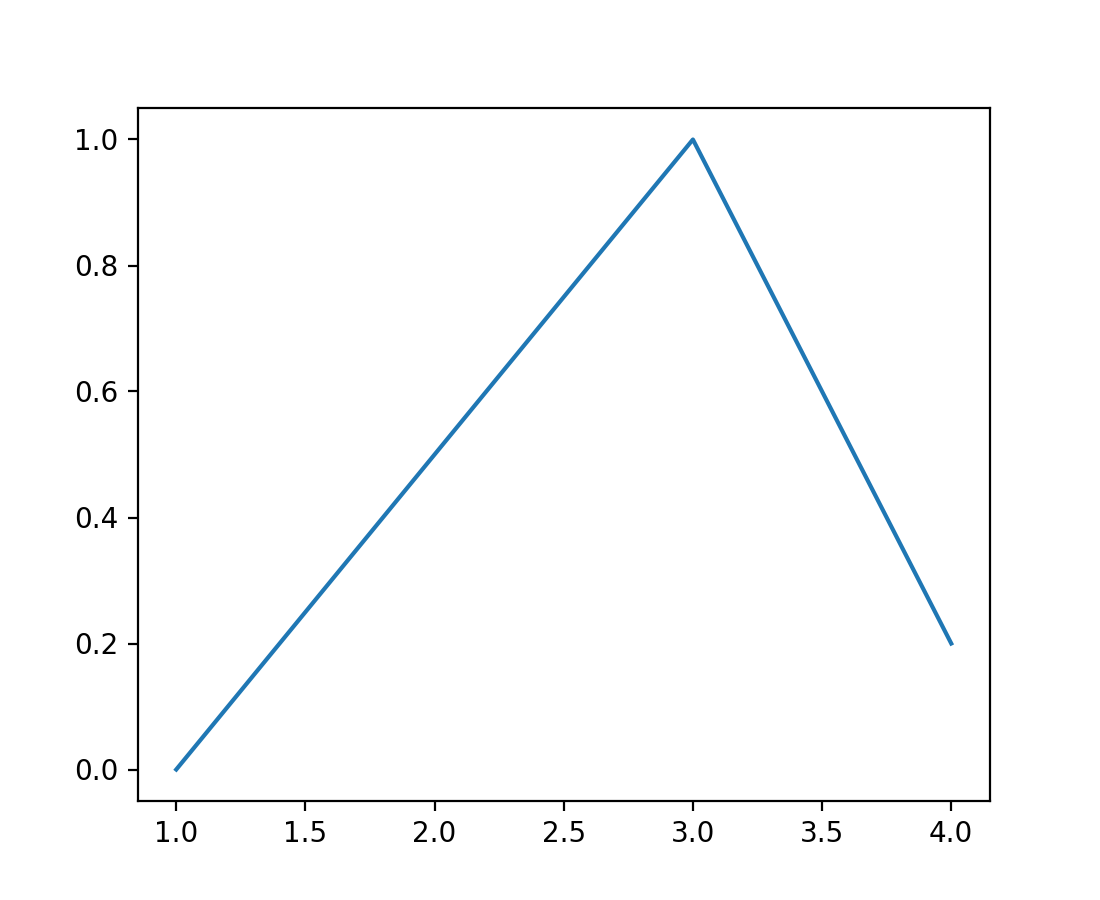
我们将这称为“显式”接口,因为每个对象都被显式引用,并用于创建下一个对象。保留对对象的引用非常灵活,允许我们在对象创建后但在显示前对其进行自定义。
隐式“pyplot”接口#
pyplot 模块影射了大部分 Axes 绘图方法,以提供与上述等效的功能,其中 Figure 和 Axes 的创建由用户完成。
import matplotlib.pyplot as plt

plt.plot([1, 2, 3, 4], [0, 0.5, 1, 0.2])

这可能很方便,尤其是在进行交互式工作或简单脚本时。可以使用 gcf 检索当前 Figure 的引用,并使用 gca 检索当前 Axes 的引用。pyplot 模块保留了 Figures 列表,每个 Figure 都为用户保留了 Figure 上的 Axes 列表,因此以下代码
import matplotlib.pyplot as plt

plt.subplot(1, 2, 1)
plt.plot([1, 2, 3], [0, 0.5, 0.2])

plt.subplot(1, 2, 2)
plt.plot([3, 2, 1], [0, 0.5, 0.2])
等同于
import matplotlib.pyplot as plt

plt.subplot(1, 2, 1)
ax = plt.gca()
ax.plot([1, 2, 3], [0, 0.5, 0.2])

plt.subplot(1, 2, 2)
ax = plt.gca()
ax.plot([3, 2, 1], [0, 0.5, 0.2])

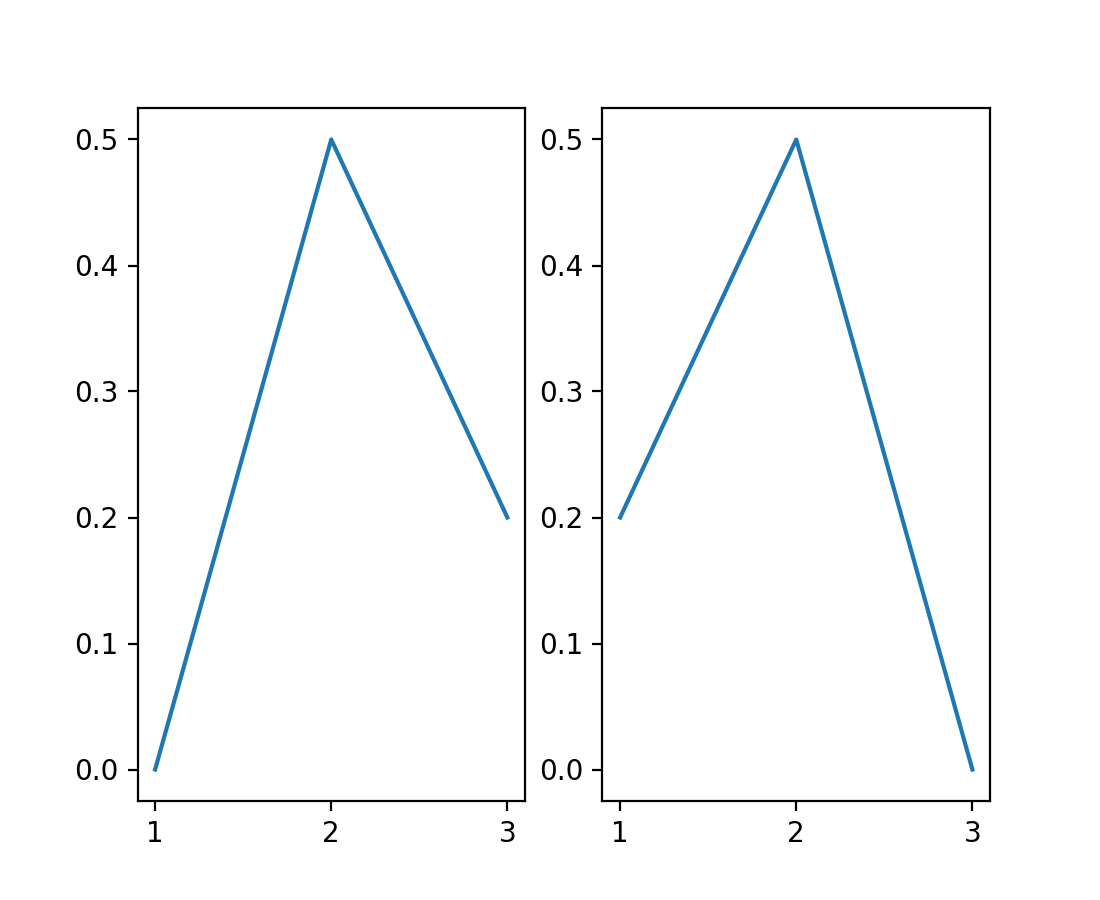
在显式接口中,这将是
import matplotlib.pyplot as plt

fig, axs = plt.subplots(1, 2)
axs[0].plot([1, 2, 3], [0, 0.5, 0.2])
axs[1].plot([3, 2, 1], [0, 0.5, 0.2])

在 Axes 接口和 pyplot 接口之间进行转换#
你可能会在现有代码中找到这两种接口,不幸的是有时甚至会混用。本节描述了两种接口中特定操作的模式以及如何相互转换。
创建 Figure 对于两种接口来说是相同的:使用各自的
pyplot函数plt.figure()、plt.subplots()、plt.subplot_mosaic()。对于 Axes 接口,你通常会将创建的 Figure(以及可能的 Axes)存储在变量中以供后续使用。使用 pyplot 接口时,这些值通常不存储。例如:Axes:
fig, ax = plt.subplots()pyplot:
plt.subplots()
“绘图”函数,即添加数据的函数,在 Axes 和 pyplot 中命名相同且参数相同。例如:
Axes:
ax.plot(x, y)pyplot:
plt.plot(x, y)
检索属性的函数在 pyplot 中命名为属性名称,在 Axes 中则以
get_为前缀。例如:Axes:
label = ax.get_xlabel()pyplot:
label = plt.xlabel()
设置属性的函数在 pyplot 中命名为属性名称,在 Axes 中则以
set_为前缀。例如:Axes:
ax.set_xlabel("time")pyplot:
plt.xlabel("time")
以下是这些示例的简短总结,以并排比较的形式呈现
操作 |
Axes 接口 |
pyplot 接口 |
|---|---|---|
创建 Figures |
|
|
绘制数据 |
|
|
获取属性 |
|
|
设置属性 |
|
|
为什么要显式?#
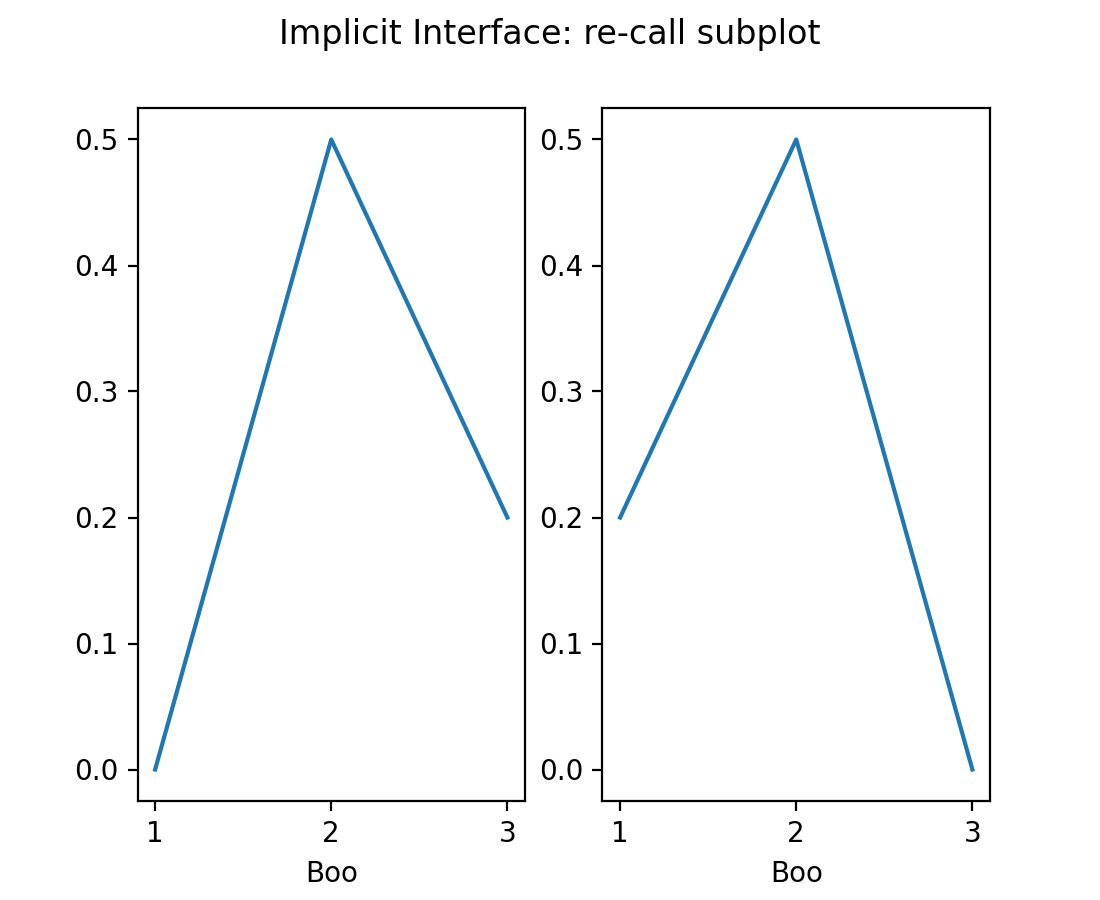
如果你需要回溯并操作一个未被 plt.gca() 引用的旧 Axes,会发生什么?一个简单的方法是再次使用相同的参数调用 subplot。然而,这很快就会变得笨拙。你也可以检查 Figure 对象并获取其 Axes 对象列表,但这可能会产生误导(colorbar 也是 Axes!)。最好的解决方案可能是保存你创建的每个 Axes 的句柄,但如果你这样做,为什么不干脆在一开始就创建所有 Axes 对象呢?
第一种方法是再次调用 plt.subplot
import matplotlib.pyplot as plt

plt.subplot(1, 2, 1)
plt.plot([1, 2, 3], [0, 0.5, 0.2])

plt.subplot(1, 2, 2)
plt.plot([3, 2, 1], [0, 0.5, 0.2])

plt.suptitle('Implicit Interface: re-call subplot')

for i in range(1, 3):
    plt.subplot(1, 2, i)
    plt.xlabel('Boo')
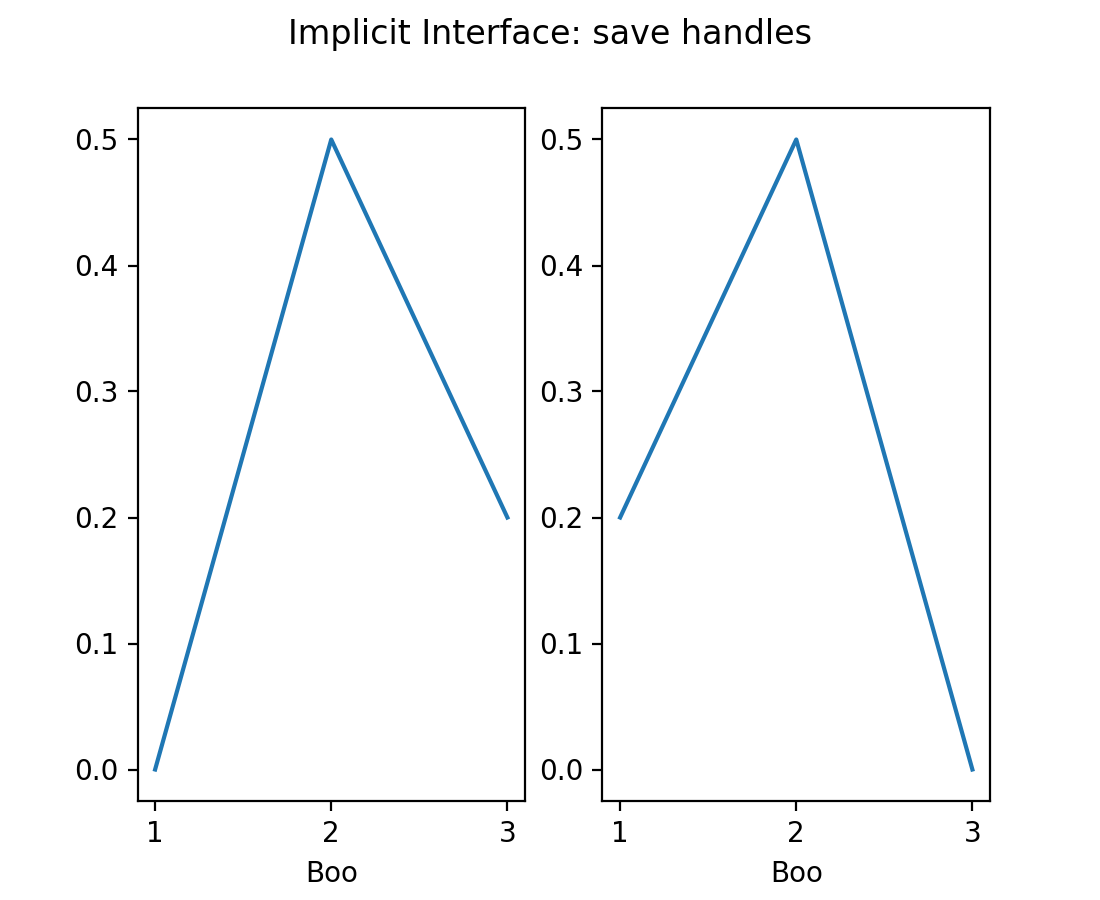
第二种是保存句柄
import matplotlib.pyplot as plt

axs = []
ax = plt.subplot(1, 2, 1)
axs += [ax]
plt.plot([1, 2, 3], [0, 0.5, 0.2])

ax = plt.subplot(1, 2, 2)
axs += [ax]
plt.plot([3, 2, 1], [0, 0.5, 0.2])

plt.suptitle('Implicit Interface: save handles')

for i in range(2):
    plt.sca(axs[i])
    plt.xlabel('Boo')
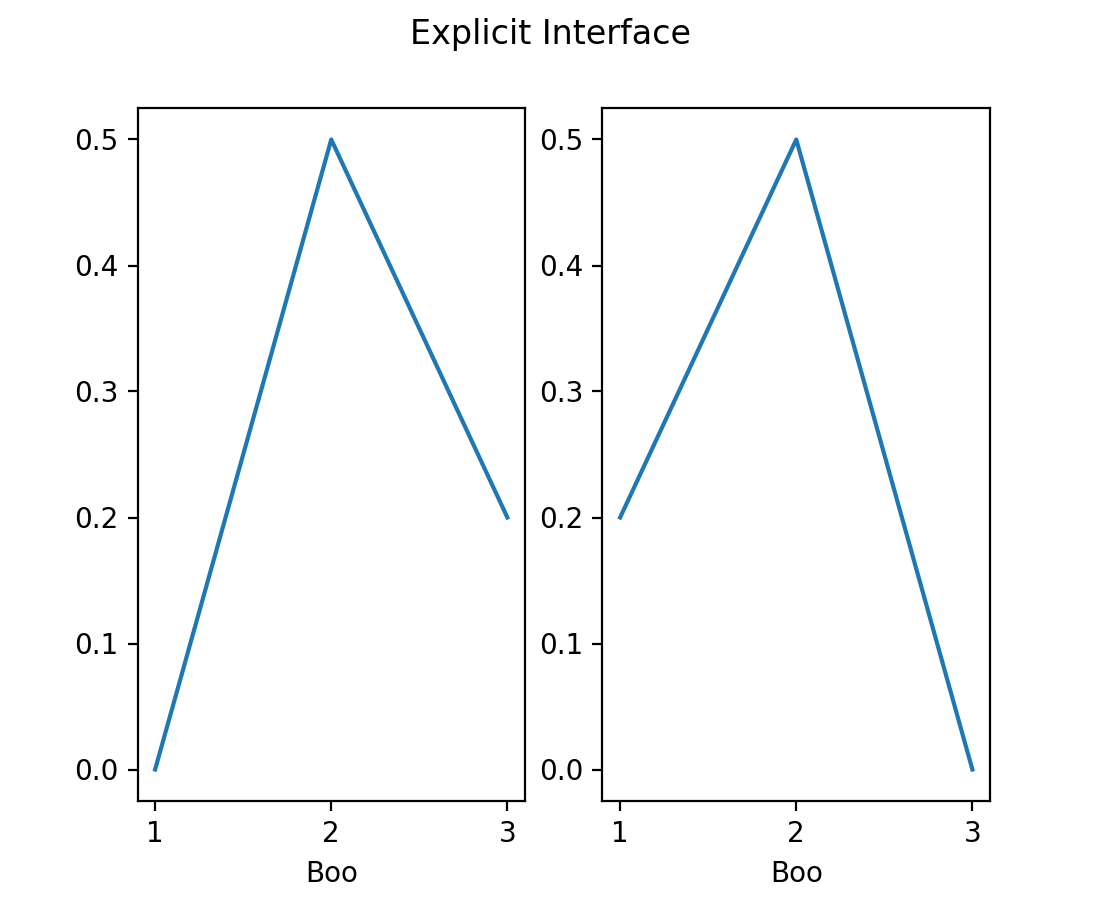
然而,推荐的方式是从一开始就明确
import matplotlib.pyplot as plt

fig, axs = plt.subplots(1, 2)
axs[0].plot([1, 2, 3], [0, 0.5, 0.2])
axs[1].plot([3, 2, 1], [0, 0.5, 0.2])
fig.suptitle('Explicit Interface')
for i in range(2):
    axs[i].set_xlabel('Boo')
第三方库“数据对象”接口#
一些第三方库选择为其数据对象实现绘图功能,例如在 pandas、xarray 和其他第三方库中可以看到 data.plot()。为了说明目的,下游库可能会实现一个简单的数据容器,其中 x 和 y 数据存储在一起,然后实现一个 plot 方法
import matplotlib.pyplot as plt

# supplied by downstream library:
class DataContainer:

    def __init__(self, x, y):
        """
        Proper docstring here!
        """
        self._x = x
        self._y = y

    def plot(self, ax=None, **kwargs):
        if ax is None:
            ax = plt.gca()
        ax.plot(self._x, self._y, **kwargs)
        ax.set_title('Plotted from DataClass!')
        return ax


# what the user usually calls:
data = DataContainer([0, 1, 2, 3], [0, 0.2, 0.5, 0.3])
data.plot()
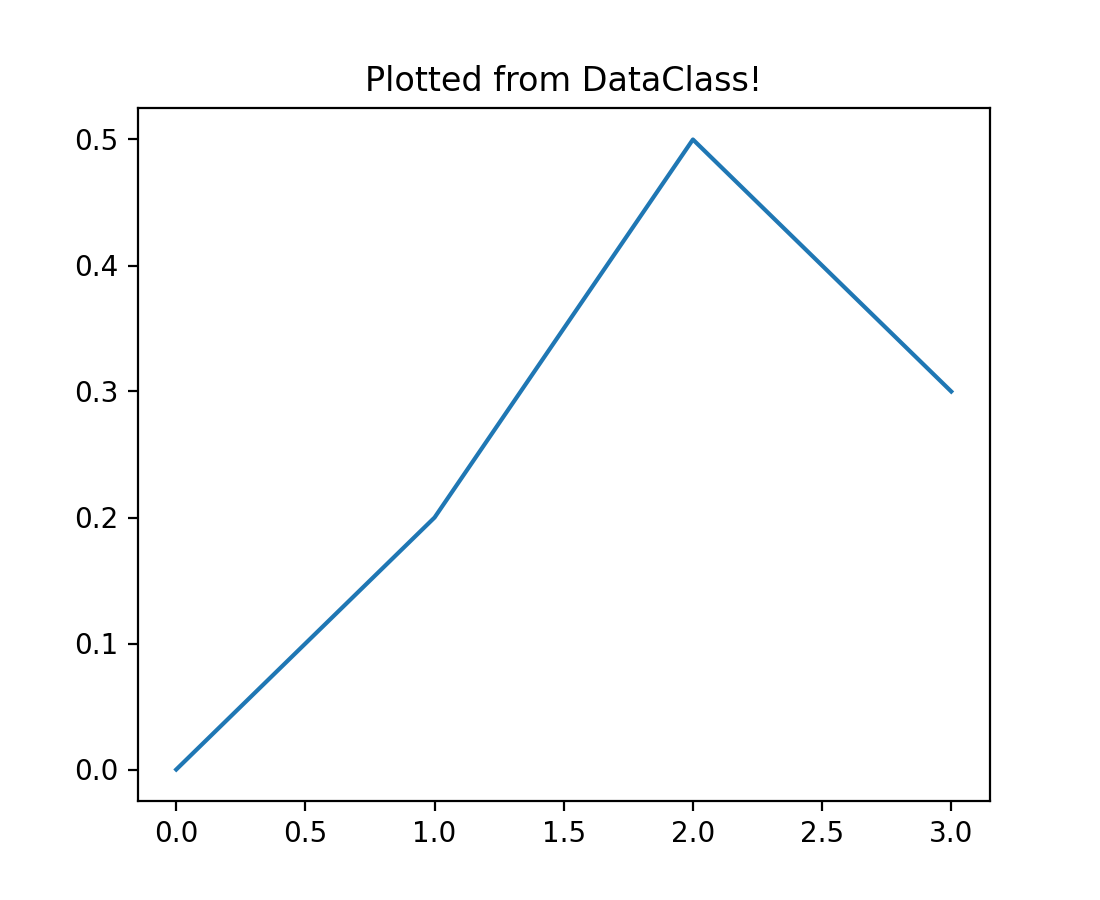
因此,库可以向用户隐藏所有繁琐的细节,并为数据类型提供合适的可视化,通常具有良好的标签、颜色映射选择以及其他方便的功能。
然而,在上述示例中,我们可能不喜欢库提供的标题。值得庆幸的是,它们从 plot() 方法中将 Axes 传递给我们,理解了显式 Axes 接口后,我们可以调用:ax.set_title('My preferred title') 来自定义标题。
许多库还允许其 plot 方法接受可选的 ax 参数。这使我们能够将可视化放置在我们已经放置并可能自定义的 Axes 中。
总结#
总的来说,理解显式“Axes”接口是有用的,因为它最灵活,并且是其他接口的基础。用户通常可以找出如何降级到显式接口并操作底层对象。虽然显式接口设置起来可能有些冗长,但复杂的绘图通常会比尝试使用隐式“pyplot”接口更简单。
注意
人们有时会感到困惑,为什么我们为两种接口都导入 pyplot。目前,pyplot 模块实现了“pyplot”接口,但它也提供了顶层的 Figure 和 Axes 创建方法,如果正在使用图形用户界面,它最终会启动它。因此,无论选择哪种接口,仍然需要 pyplot。
同样,合作伙伴库提供的声明性接口使用可通过“Axes”接口访问的对象,并且通常将这些对象作为参数接受或从方法中返回。要对默认可视化进行任何自定义,或者将数据解包为 NumPy 数组并直接传递给 Matplotlib,通常需要使用显式“Axes”接口。
附录:带有数据结构的“Axes”接口#
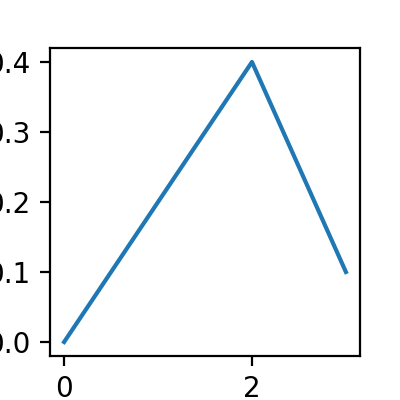
大多数 Axes 方法允许通过将 data 对象传递给方法并将参数指定为字符串来进一步进行 API 寻址
import matplotlib.pyplot as plt

data = {'xdat': [0, 1, 2, 3], 'ydat': [0, 0.2, 0.4, 0.1]}
fig, ax = plt.subplots(figsize=(2, 2))
ax.plot('xdat', 'ydat', data=data)
附录:“pylab”接口#
还有一种接口是极不推荐的,那就是基本上执行 from matplotlib.pylab import *。这会将 matplotlib.pyplot、numpy、numpy.fft、numpy.linalg 和 numpy.random 中的所有函数以及一些附加函数导入到全局命名空间中。
这种模式在现代 Python 中被认为是糟糕的做法,因为它会污染全局命名空间。更严重的是,对于 pylab 的情况,这会覆盖一些内置函数(例如内置的 sum 将被 numpy.sum 替换),这可能导致意想不到的行为。