注意
前往文末以下载完整的示例代码。
图例指南#
本图例指南扩展了legend文档字符串 - 在继续阅读本指南之前,请务必阅读它。
本指南使用了一些常见术语,为便于理解,此处对这些术语进行说明
- 图例条目#
一个图例由一个或多个图例条目组成。每个条目由一个键和一个标签精确组成。
- 图例键#
每个图例标签左侧的彩色/图案标记。
- 图例标签#
描述由该键所代表的句柄的文本。
- 图例句柄#
用于在图例中生成相应条目的原始对象。
控制图例条目#
不带参数调用legend()会自动获取图例句柄及其关联标签。此功能等同于
函数get_legend_handles_labels()返回 Axes 上存在的句柄/artist 列表,这些句柄/artist 可用于为生成的图例创建条目——然而值得注意的是,并非所有 artist 都能添加到图例中,此时需要创建一个“代理”(详见专门为添加到图例而创建 artist(即代理 artist))。
注意
标签为空字符串或以下划线“_”开头的 artist 将被忽略。
为了完全控制添加到图例中的内容,通常会直接将相应的句柄传递给legend()。
重命名图例条目#
当标签无法直接设置在句柄上时,可以直接将它们传递给Axes.legend。
如果句柄无法直接访问,例如在使用某些第三方包时,可以通过Axes.get_legend_handles_labels访问它们。这里我们使用一个字典来重命名现有标签
专门为添加到图例而创建 artist(即代理 artist)#
并非所有句柄都能自动转换为图例条目,因此通常需要创建一个可以的 artist。图例句柄不一定需要存在于 Figure 或 Axes 上才能使用。
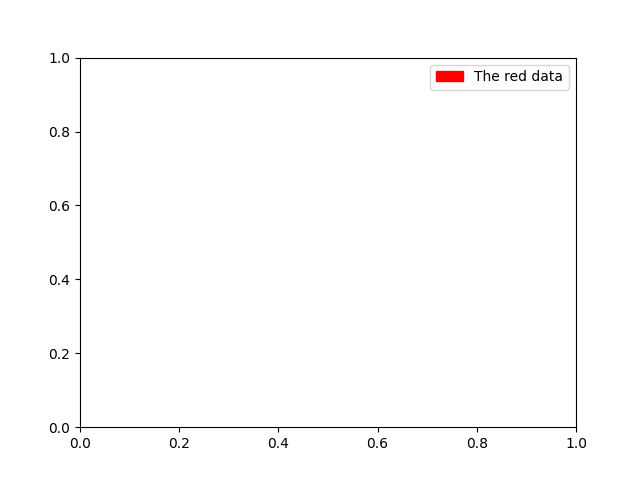
假设我们想创建一个图例,其中包含由红色表示的数据条目
import matplotlib.pyplot as plt

import matplotlib.patches as mpatches

fig, ax = plt.subplots()
red_patch = mpatches.Patch(color='red', label='The red data')
ax.legend(handles=[red_patch])

plt.show()
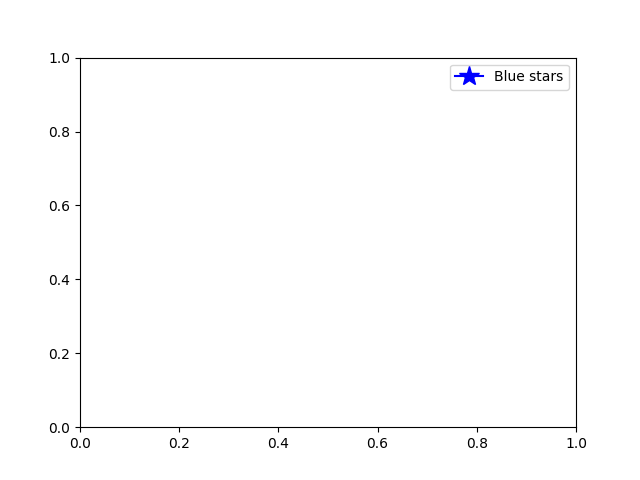
有许多受支持的图例句柄。除了创建一个颜色块,我们还可以创建一个带标记的线条。
import matplotlib.lines as mlines

fig, ax = plt.subplots()
blue_line = mlines.Line2D([], [], color='blue', marker='*',
                          markersize=15, label='Blue stars')
ax.legend(handles=[blue_line])

plt.show()
图例位置#
图例的位置可以通过关键字参数loc来指定。更多详情请参阅legend()的文档。
bbox_to_anchor关键字为手动放置图例提供了很大的控制自由度。例如,如果您希望 Axes 图例位于图形的右上角而不是 Axes 的角落,只需指定该角的位置及其坐标系即可。
更多自定义图例放置的示例
fig, ax_dict = plt.subplot_mosaic([['top', 'top'], ['bottom', 'BLANK']],
                                  empty_sentinel="BLANK")
ax_dict['top'].plot([1, 2, 3], label="test1")
ax_dict['top'].plot([3, 2, 1], label="test2")
# Place a legend above this subplot, expanding itself to
# fully use the given bounding box.
ax_dict['top'].legend(bbox_to_anchor=(0., 1.02, 1., .102), loc='lower left',
                      ncols=2, mode="expand", borderaxespad=0.)

ax_dict['bottom'].plot([1, 2, 3], label="test1")
ax_dict['bottom'].plot([3, 2, 1], label="test2")
# Place a legend to the right of this smaller subplot.
ax_dict['bottom'].legend(bbox_to_anchor=(1.05, 1),
                         loc='upper left', borderaxespad=0.)
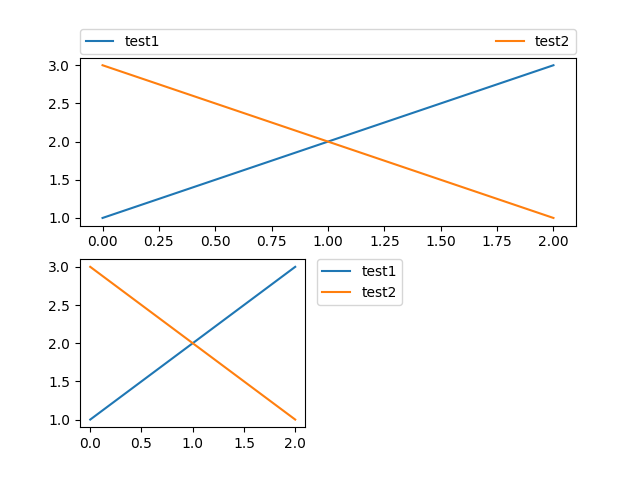
Figure 图例#
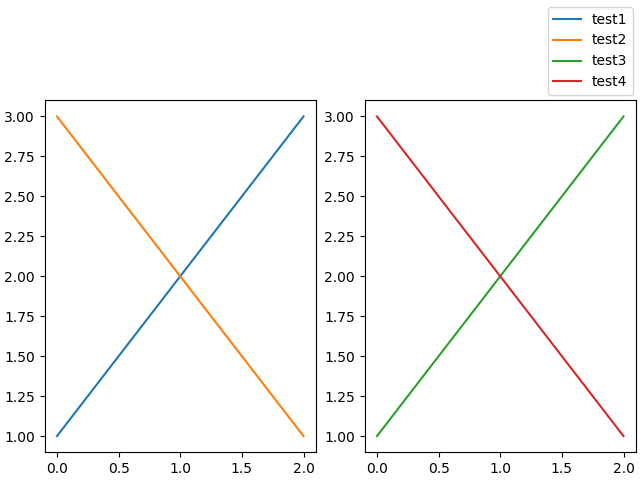
有时,将图例相对于(子)图形而非单个 Axes 放置更有意义。通过使用约束布局并在loc关键字参数的开头指定“outside”,图例将在(子)图形上绘制于 Axes 之外。
fig, axs = plt.subplot_mosaic([['left', 'right']], layout='constrained')

axs['left'].plot([1, 2, 3], label="test1")
axs['left'].plot([3, 2, 1], label="test2")

axs['right'].plot([1, 2, 3], 'C2', label="test3")
axs['right'].plot([3, 2, 1], 'C3', label="test4")
# Place a legend to the right of this smaller subplot.
fig.legend(loc='outside upper right')
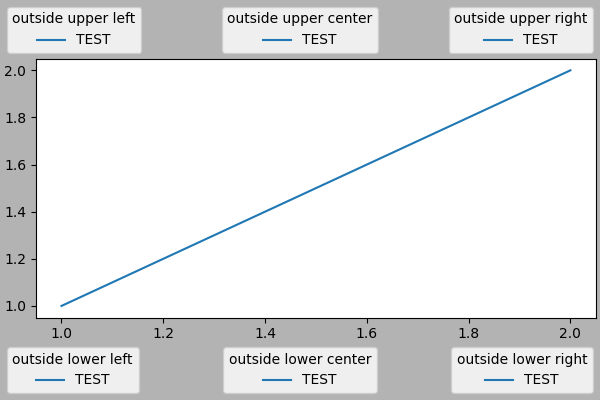
这接受一种与正常loc关键字略有不同的语法,其中“outside right upper”与“outside upper right”不同。
ucl = ['upper', 'center', 'lower']
lcr = ['left', 'center', 'right']
fig, ax = plt.subplots(figsize=(6, 4), layout='constrained', facecolor='0.7')
ax.plot([1, 2], [1, 2], label='TEST')
# Place a legend to the right of this smaller subplot.
for loc in [
'outside upper left',
'outside upper center',
'outside upper right',
'outside lower left',
'outside lower center',
'outside lower right']:
fig.legend(loc=loc, title=loc)
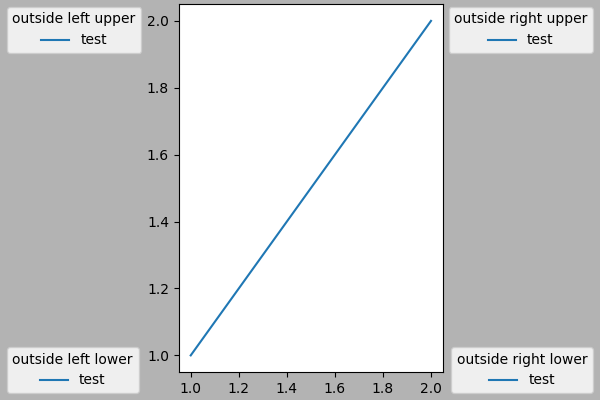
fig, ax = plt.subplots(figsize=(6, 4), layout='constrained', facecolor='0.7')
ax.plot([1, 2], [1, 2], label='test')
for loc in [
'outside left upper',
'outside right upper',
'outside left lower',
'outside right lower']:
fig.legend(loc=loc, title=loc)
同一 Axes 上的多个图例#
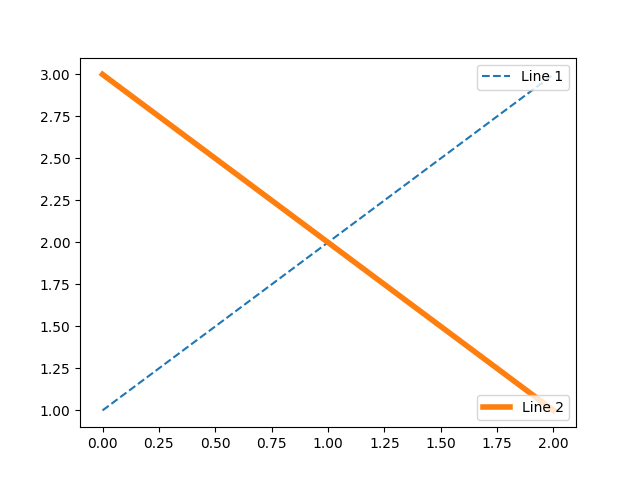
有时,将图例条目拆分到多个图例中会更清晰。虽然本能的做法可能是多次调用legend()函数,但您会发现 Axes 上始终只存在一个图例。这样做是为了能够重复调用legend(),以便将图例更新为 Axes 上的最新句柄。要保留旧的图例实例,我们必须手动将它们添加到 Axes 中。
fig, ax = plt.subplots()
line1, = ax.plot([1, 2, 3], label="Line 1", linestyle='--')
line2, = ax.plot([3, 2, 1], label="Line 2", linewidth=4)

# Create a legend for the first line.
first_legend = ax.legend(handles=[line1], loc='upper right')

# Add the legend manually to the Axes.
ax.add_artist(first_legend)

# Create another legend for the second line.
ax.legend(handles=[line2], loc='lower right')

plt.show()
图例处理器#
为了创建图例条目,句柄作为参数传递给相应的HandlerBase子类。处理器子类的选择由以下规则决定:
使用
handler_map关键字中的值更新get_legend_handler_map()。检查
handle是否在新创建的handler_map中。检查
handle的类型是否在新创建的handler_map中。检查
handle的mro中的任何类型是否在新创建的handler_map中。
为了完整性,此逻辑主要在get_legend_handler()中实现。
所有这些灵活性意味着我们拥有实现自定义处理器以处理我们自己的图例键类型所需的钩子。
使用自定义处理器的最简单示例是实例化现有的legend_handler.HandlerBase子类之一。为简单起见,我们选择legend_handler.HandlerLine2D,它接受一个numpoints参数(为方便起见,numpoints 也是legend()函数的一个关键字)。然后我们可以将实例到 Handler 的映射作为关键字传递给 legend。
from matplotlib.legend_handler import HandlerLine2D

fig, ax = plt.subplots()
line1, = ax.plot([3, 2, 1], marker='o', label='Line 1')
line2, = ax.plot([1, 2, 3], marker='o', label='Line 2')

ax.legend(handler_map={line1: HandlerLine2D(numpoints=4)}, handlelength=4)
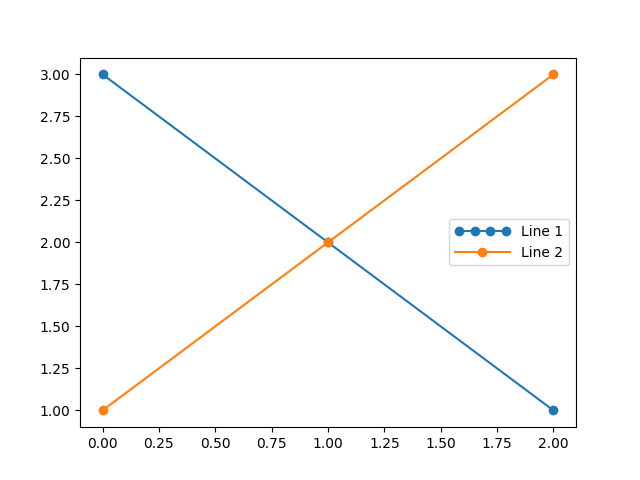
如您所见,“Line 1”现在有 4 个标记点,而“Line 2”有 2 个(默认值)。我们还使用handlelength关键字增加了句柄的长度,以适应更大的图例条目。尝试以上代码,只需将映射的键从line1更改为type(line1)。请注意,现在两个Line2D实例都获得了 4 个标记。
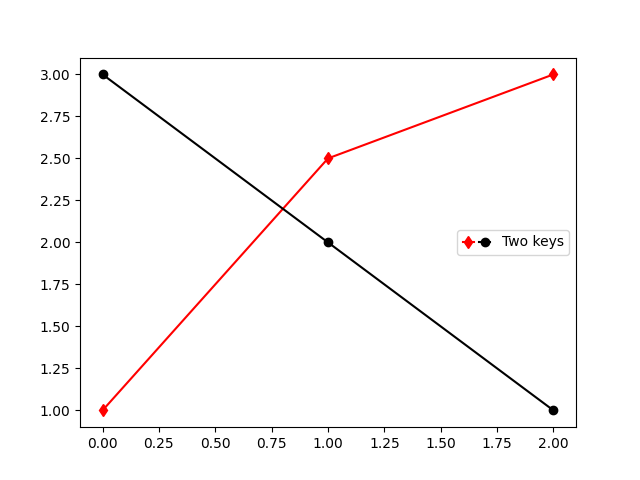
除了用于复杂绘图类型(如误差条、茎叶图和直方图)的处理器之外,默认的handler_map有一个特殊的tuple处理器(legend_handler.HandlerTuple),它只是将给定元组中的每个项的句柄一个接一个地绘制在一起。以下示例演示了如何将两个图例键组合在一起:
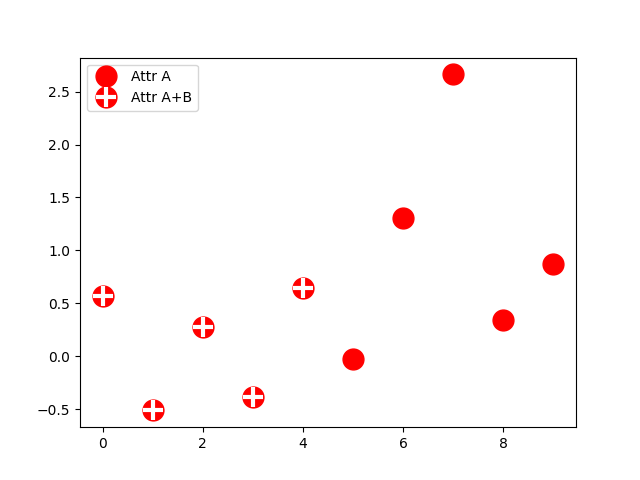
legend_handler.HandlerTuple类也可以用于将多个图例键分配给同一个条目。
from matplotlib.legend_handler import HandlerLine2D, HandlerTuple

fig, ax = plt.subplots()
p1, = ax.plot([1, 2.5, 3], 'r-d')
p2, = ax.plot([3, 2, 1], 'k-o')

l = ax.legend([(p1, p2)], ['Two keys'], numpoints=1,
              handler_map={tuple: HandlerTuple(ndivide=None)})
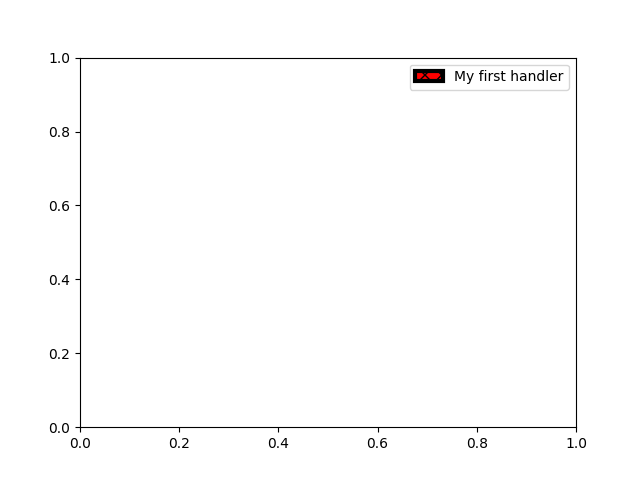
实现自定义图例处理器#
可以实现自定义处理器,将任何句柄转换为图例键(句柄不一定是 matplotlib artist)。该处理器必须实现一个legend_artist方法,该方法返回一个供图例使用的单个 artist。legend_artist所需的签名在legend_artist中有详细说明。
import matplotlib.patches as mpatches


class AnyObject:
    pass


class AnyObjectHandler:
    def legend_artist(self, legend, orig_handle, fontsize, handlebox):
        x0, y0 = handlebox.xdescent, handlebox.ydescent
        width, height = handlebox.width, handlebox.height
        patch = mpatches.Rectangle([x0, y0], width, height, facecolor='red',
                                   edgecolor='black', hatch='xx', lw=3,
                                   transform=handlebox.get_transform())
        handlebox.add_artist(patch)
        return patch

fig, ax = plt.subplots()

ax.legend([AnyObject()], ['My first handler'],
          handler_map={AnyObject: AnyObjectHandler()})
或者,如果我们想全局接受AnyObject实例,而无需一直手动设置handler_map关键字,我们可以通过以下方式注册新的处理器:
from matplotlib.legend import Legend
Legend.update_default_handler_map({AnyObject: AnyObjectHandler()})
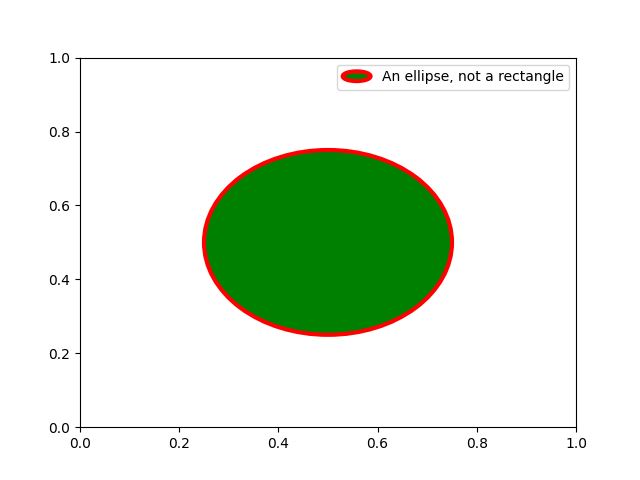
虽然这里的强大之处显而易见,但请记住,已经实现了许多处理器,并且您想要实现的目标可能已经可以通过现有类轻松实现。例如,要生成椭圆形而不是矩形图例键:
from matplotlib.legend_handler import HandlerPatch


class HandlerEllipse(HandlerPatch):
    def create_artists(self, legend, orig_handle,
                       xdescent, ydescent, width, height, fontsize, trans):
        center = 0.5 * width - 0.5 * xdescent, 0.5 * height - 0.5 * ydescent
        p = mpatches.Ellipse(xy=center, width=width + xdescent,
                             height=height + ydescent)
        self.update_prop(p, orig_handle, legend)
        p.set_transform(trans)
        return [p]


c = mpatches.Circle((0.5, 0.5), 0.25, facecolor="green",
                    edgecolor="red", linewidth=3)

fig, ax = plt.subplots()

ax.add_patch(c)
ax.legend([c], ["An ellipse, not a rectangle"],
          handler_map={mpatches.Circle: HandlerEllipse()})
脚本总运行时间: (0 分 6.610 秒)