注意
跳到末尾下载完整的示例代码。
文本属性和布局#
使用 Matplotlib 控制文本属性及其布局。
matplotlib.text.Text 实例具有各种属性,可以通过关键字参数配置,例如 set_title、set_xlabel、text 等。
属性 |
值 类型 |
|---|---|
alpha |
|
backgroundcolor |
任何 Matplotlib 颜色 |
bbox |
|
clip_box |
一个 matplotlib.transform.Bbox 实例 |
clip_on |
布尔值 |
clip_path |
|
color |
任何 Matplotlib 颜色 |
family |
[ |
fontproperties |
|
horizontalalignment 或 ha |
[ |
label |
任何字符串 |
linespacing |
|
multialignment |
[ |
name 或 fontname |
字符串,例如 [ |
picker |
[None|float|bool|callable] |
position |
(x, y) |
rotation |
[ 角度(度) | |
size 或 fontsize |
[ 尺寸(点) | 相对尺寸,例如 |
style 或 fontstyle |
[ |
text |
字符串或任何可以用 '%s' 转换打印的内容 |
transform |
|
variant |
[ |
verticalalignment 或 va |
[ |
visible |
布尔值 |
weight 或 fontweight |
[ |
x |
|
y |
|
zorder |
任何数字 |
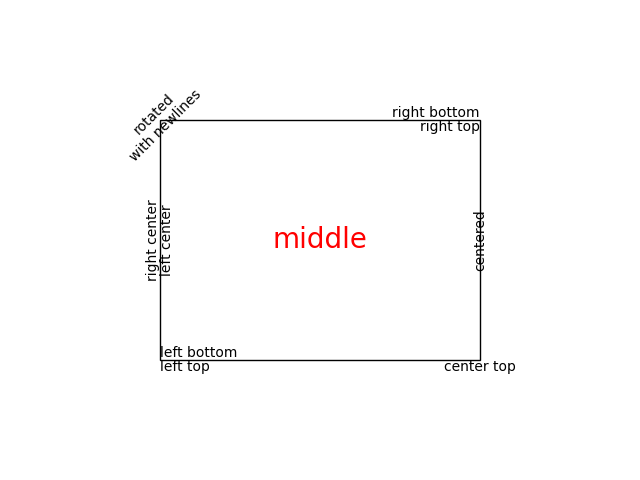
您可以使用对齐参数 horizontalalignment、verticalalignment 和 multialignment 来布局文本。horizontalalignment 控制文本的 x 位置参数是表示文本边界框的左侧、中心还是右侧。verticalalignment 控制文本的 y 位置参数是表示文本边界框的底部、中心还是顶部。multialignment(仅适用于通过换行符分隔的字符串)控制不同行是左对齐、居中对齐还是右对齐。这是一个示例,它使用 text() 命令来展示各种对齐可能性。代码中通篇使用 transform=ax.transAxes 表示坐标是相对于坐标轴边界框给出的,其中 (0, 0) 是坐标轴的左下角,(1, 1) 是右上角。
import matplotlib.pyplot as plt

import matplotlib.patches as patches

# build a rectangle in axes coords
left, width = .25, .5
bottom, height = .25, .5
right = left + width
top = bottom + height

fig = plt.figure()
ax = fig.add_axes([0, 0, 1, 1])

# axes coordinates: (0, 0) is bottom left and (1, 1) is upper right
p = patches.Rectangle(
    (left, bottom), width, height,
    fill=False, transform=ax.transAxes, clip_on=False
    )

ax.add_patch(p)

ax.text(left, bottom, 'left top',
        horizontalalignment='left',
        verticalalignment='top',
        transform=ax.transAxes)

ax.text(left, bottom, 'left bottom',
        horizontalalignment='left',
        verticalalignment='bottom',
        transform=ax.transAxes)

ax.text(right, top, 'right bottom',
        horizontalalignment='right',
        verticalalignment='bottom',
        transform=ax.transAxes)

ax.text(right, top, 'right top',
        horizontalalignment='right',
        verticalalignment='top',
        transform=ax.transAxes)

ax.text(right, bottom, 'center top',
        horizontalalignment='center',
        verticalalignment='top',
        transform=ax.transAxes)

ax.text(left, 0.5*(bottom+top), 'right center',
        horizontalalignment='right',
        verticalalignment='center',
        rotation='vertical',
        transform=ax.transAxes)

ax.text(left, 0.5*(bottom+top), 'left center',
        horizontalalignment='left',
        verticalalignment='center',
        rotation='vertical',
        transform=ax.transAxes)

ax.text(0.5*(left+right), 0.5*(bottom+top), 'middle',
        horizontalalignment='center',
        verticalalignment='center',
        fontsize=20, color='red',
        transform=ax.transAxes)

ax.text(right, 0.5*(bottom+top), 'centered',
        horizontalalignment='center',
        verticalalignment='center',
        rotation='vertical',
        transform=ax.transAxes)

ax.text(left, top, 'rotated\nwith newlines',
        horizontalalignment='center',
        verticalalignment='center',
        rotation=45,
        transform=ax.transAxes)

ax.set_axis_off()
plt.show()
默认字体#
基础默认字体由一组 rcParams 控制。要设置数学表达式的字体,请使用以 mathtext 开头的 rcParams(参见 数学文本)。
rcParam |
用法 |
|---|---|
|
字体家族列表(用户机器上已安装的)和/或 |
|
默认样式,例如 |
|
默认变体,例如 |
|
默认拉伸,例如 |
|
默认字重。可以是字符串或整数。 |
|
默认字体大小(磅)。相对字体大小( |
Matplotlib 可以使用用户计算机上安装的字体家族,例如 Helvetica、Times 等。字体家族也可以通过通用家族别名指定,如 ({'cursive', 'fantasy', 'monospace', 'sans', 'sans serif', 'sans-serif', 'serif'})。
注意
要访问所有可用字体的完整列表
matplotlib.font_manager.get_font_names()
通用家族别名和实际字体家族之间的映射(在默认 rcParams 中提到)由以下 rcParams 控制
基于 CSS 的通用家族别名 |
带有映射的 rcParam |
|---|---|
|
|
|
|
|
|
|
|
|
|
如果任何通用家族名称出现在 'font.family' 中,我们将该条目替换为相应的 rcParam 映射中的所有条目。例如
matplotlib.rcParams['font.family'] = ['Family1', 'serif', 'Family2']
matplotlib.rcParams['font.serif'] = ['SerifFamily1', 'SerifFamily2']

# This is effectively translated to:
matplotlib.rcParams['font.family'] = ['Family1', 'SerifFamily1', 'SerifFamily2', 'Family2']
包含非拉丁字符的文本#
自 v2.0 起,默认字体 DejaVu 包含许多西方字母的字形,但不包含其他脚本的字形,如中文、韩语或日语。
要将默认字体设置为支持您需要的代码点的字体,请将字体名称添加到 'font.family' 的开头(推荐),或添加到所需的别名列表中。
# first method
matplotlib.rcParams['font.family'] = ['Source Han Sans TW', 'sans-serif']

# second method
matplotlib.rcParams['font.family'] = ['sans-serif']
matplotlib.rcParams['sans-serif'] = ['Source Han Sans TW', ...]
通用家族别名列表包含随 Matplotlib 一起提供的字体(因此它们被找到的几率是100%),或极有可能在大多数系统中存在的字体。
设置自定义字体家族时,一个好的做法是将通用家族作为最后选择附加到字体家族列表。
您也可以在 .matplotlibrc 文件中进行设置
font.family: Source Han Sans TW, Arial, sans-serif
要按艺术家设置字体,请使用文本属性和布局中记载的 name、fontname 或 fontproperties 关键字参数。
在 Linux 上,fc-list 是一个发现字体名称的有用工具;例如
$ fc-list :lang=zh family
Noto to Sans Mono CJK TC,Noto Sans Mono CJK TC Bold
Noto Sans CJK TC,Noto Sans CJK TC Medium
Noto Sans CJK TC,Noto Sans CJK TC DemiLight
Noto Sans CJK KR,Noto Sans CJK KR Black
Noto Sans CJK TC,Noto Sans CJK TC Black
Noto Sans Mono CJK TC,Noto Sans Mono CJK TC Regular
Noto Sans CJK SC,Noto Sans CJK SC Light
列出所有支持中文的字体。