注意
跳转到末尾以下载完整的示例代码。
轴自动缩放#
轴的限制可以手动设置(例如 ax.set_xlim(xmin, xmax))或 Matplotlib 可以根据 Axes 上已有的数据自动设置。这种自动缩放行为有多种选项,将在下面讨论。
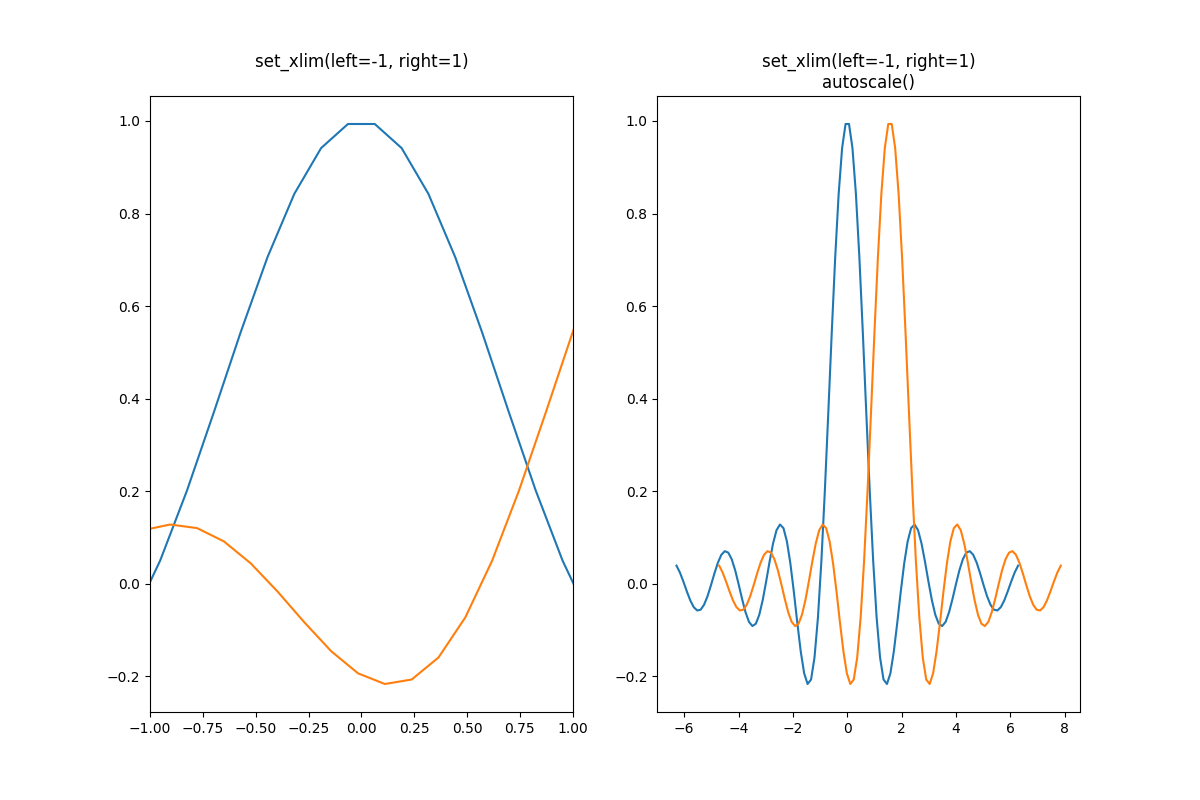
我们将从一个简单的线图开始,展示自动缩放如何将轴限制扩展到数据限制 (-2π, 2π) 之外的 5%。
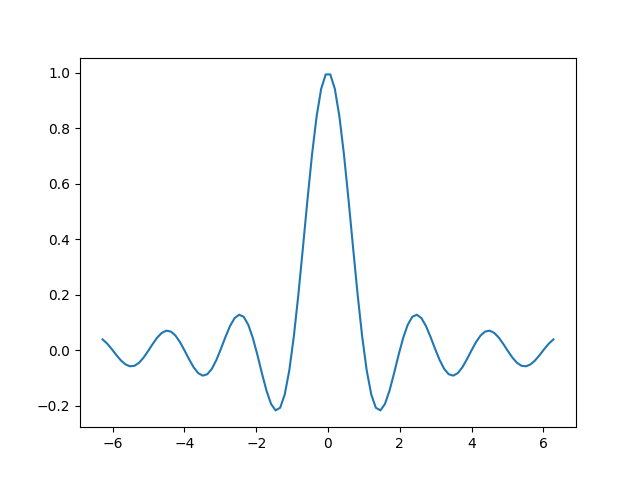
边距#
数据限制周围的默认边距为 5%,这是基于以下默认配置设置:rcParams["axes.xmargin"](默认值:0.05)、rcParams["axes.ymargin"](默认值:0.05)和 rcParams["axes.zmargin"](默认值:0.05)
print(ax.margins())
(0.05, 0.05)
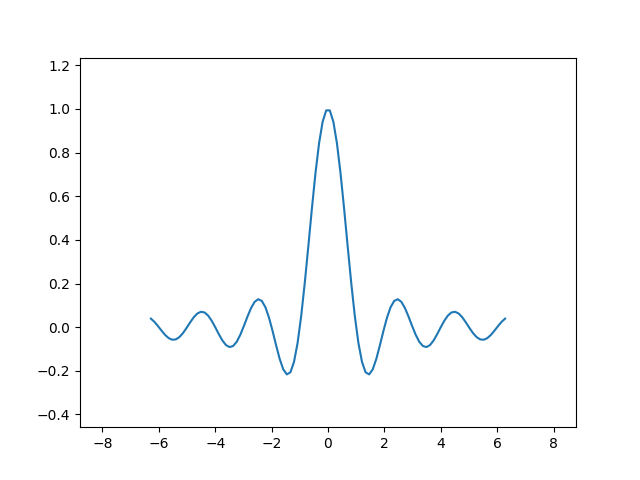
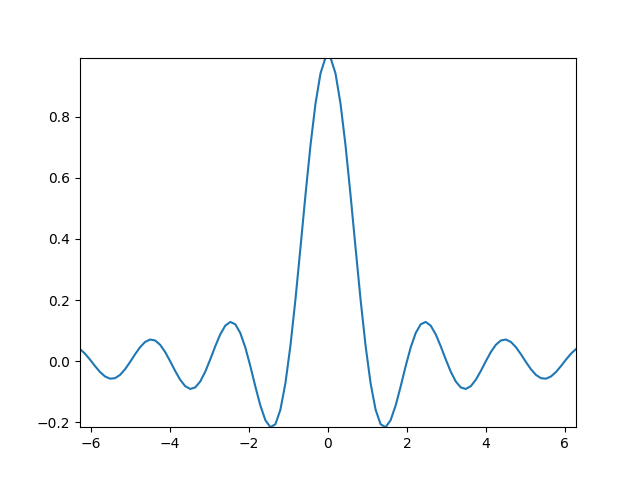
边距大小可以通过使用 margins 来覆盖,使其更小或更大。
fig, ax = plt.subplots()
ax.plot(x, y)
ax.margins(0.2, 0.2)
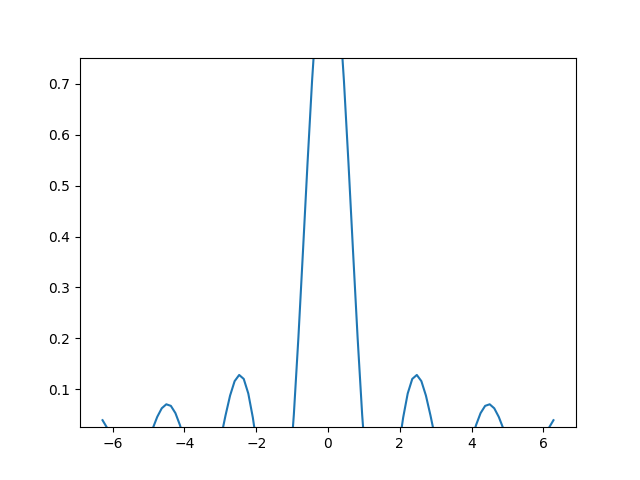
通常,边距可以在 (-0.5, ∞) 范围内,其中负边距会将轴限制设置为数据范围的一个子范围,即它们会裁剪数据。对边距使用单个数字会影响两个轴,可以使用关键字参数 x 或 y 自定义单个边距,但位置参数和关键字参数接口不能混合使用。
fig, ax = plt.subplots()
ax.plot(x, y)
ax.margins(y=-0.2)
粘滞边缘#
有一些绘图元素(Artist 对象)通常不带边距使用。例如,假彩色图像(例如使用 Axes.imshow 创建的)在边距计算中不被考虑。
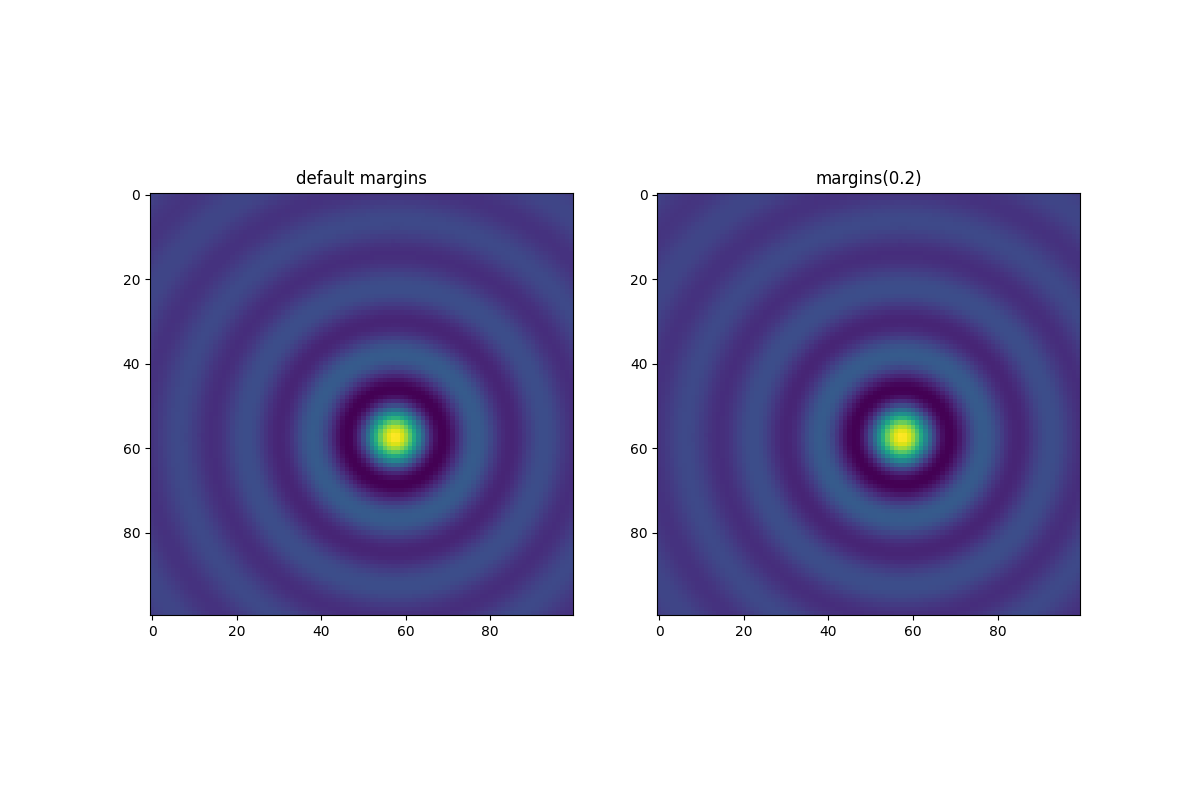
这种边距覆盖由“粘滞边缘”决定,它是 Artist 类的属性,可以抑制为轴限制添加边距。可以通过更改 use_sticky_edges 来在 Axes 上禁用粘滞边缘的效果。Artist 对象具有一个属性 Artist.sticky_edges,并且可以通过写入 Artist.sticky_edges.x 或 Artist.sticky_edges.y 来更改粘滞边缘的值。
以下示例展示了覆盖的工作方式以及何时需要它。
fig, ax = plt.subplots(ncols=3, figsize=(16, 10))
ax[0].imshow(zz)
ax[0].margins(0.2)
ax[0].set_title("default use_sticky_edges\nmargins(0.2)")
ax[1].imshow(zz)
ax[1].margins(0.2)
ax[1].use_sticky_edges = False
ax[1].set_title("use_sticky_edges=False\nmargins(0.2)")
ax[2].imshow(zz)
ax[2].margins(-0.2)
ax[2].set_title("default use_sticky_edges\nmargins(-0.2)")
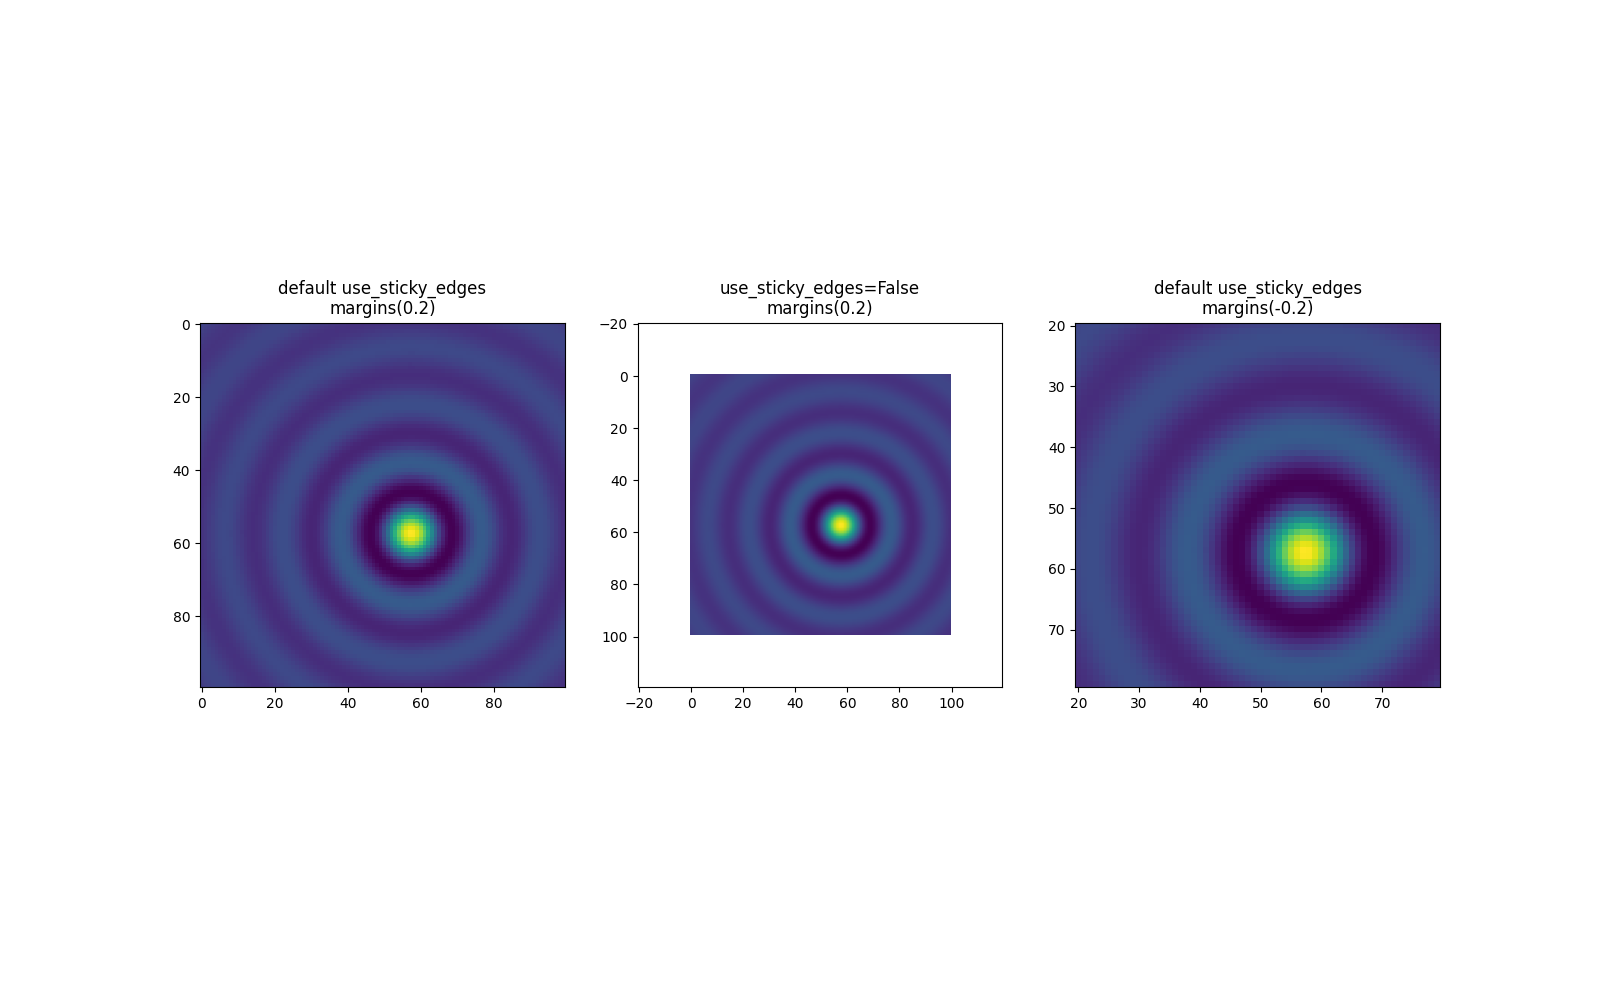
我们可以看到,将 use_sticky_edges 设置为 False 会以请求的边距渲染图像。
虽然粘滞边缘不会通过额外的边距增加轴限制,但负边距仍然会被考虑在内。这可以在第三张图像的缩小限制中看出。
控制自动缩放#
默认情况下,每次向图中添加新曲线时,都会重新计算限制。
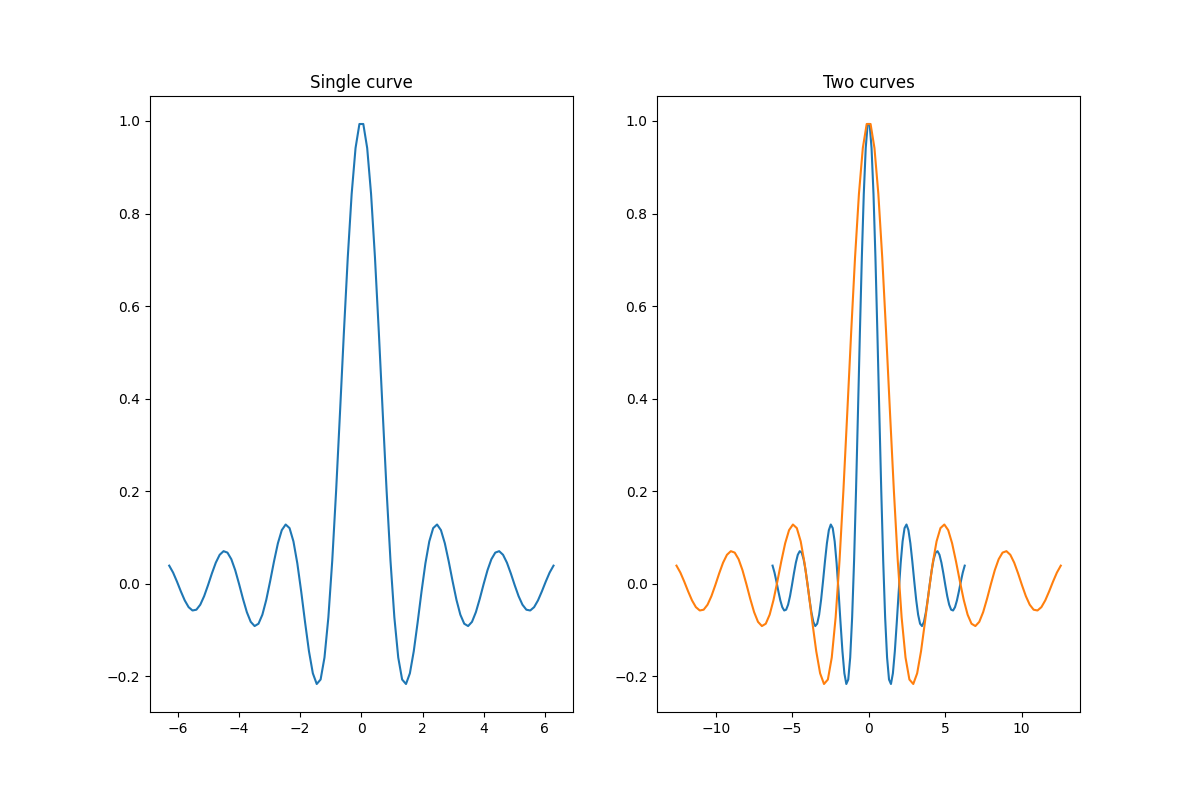
但是,有些情况下您不希望自动调整视口以适应新数据。
禁用自动缩放的一种方法是手动设置轴限制。假设我们只想更详细地查看部分数据。即使我们向数据添加更多曲线,设置 xlim 也会保持不变。要重新计算新限制,调用 Axes.autoscale 将手动切换该功能。
fig, ax = plt.subplots(ncols=2, figsize=(12, 8))
ax[0].plot(x, y)
ax[0].set_xlim(left=-1, right=1)
ax[0].plot(x + np.pi * 0.5, y)
ax[0].set_title("set_xlim(left=-1, right=1)\n")
ax[1].plot(x, y)
ax[1].set_xlim(left=-1, right=1)
ax[1].plot(x + np.pi * 0.5, y)
ax[1].autoscale()
ax[1].set_title("set_xlim(left=-1, right=1)\nautoscale()")
我们可以通过使用 Axes.get_autoscale_on() 来检查第一个图是否已禁用自动缩放,以及第二个图是否已再次启用。
False
True
autoscale 函数的参数使我们能够精确控制自动缩放过程。参数 enable 和 axis 的组合为选定的轴(或两者)设置自动缩放功能。参数 tight 将选定轴的边距设置为零。要保留 enable 或 tight 的设置,可以将另一个设置为 None,这样它就不会被修改。但是,将 enable 设置为 None 并将 tight 设置为 True 会影响两个轴,无论 axis 参数如何。
fig, ax = plt.subplots()
ax.plot(x, y)
ax.margins(0.2, 0.2)
ax.autoscale(enable=None, axis="x", tight=True)

print(ax.margins())
(0, 0)
使用集合#
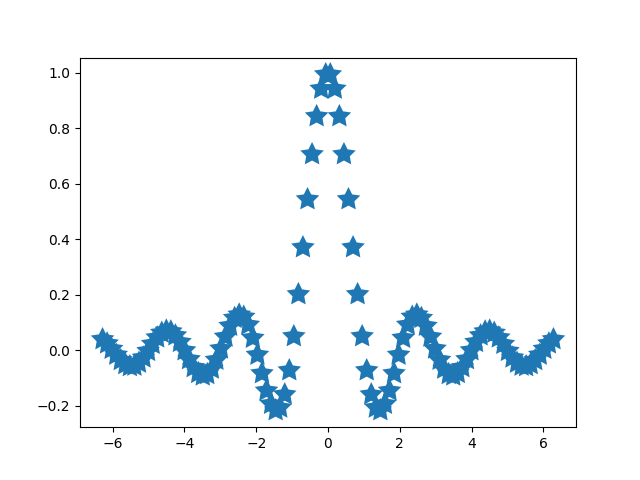
自动缩放对添加到 Axes 的所有线条、补丁和图像都开箱即用。它不适用于的其中一个 Artist 对象是 Collection。将集合添加到 Axes 后,必须手动触发 autoscale_view() 以重新计算轴限制。
fig, ax = plt.subplots()
collection = mpl.collections.StarPolygonCollection(
    5, rotation=0, sizes=(250,),  # five point star, zero angle, size 250px
    offsets=np.column_stack([x, y]),  # Set the positions
    offset_transform=ax.transData,  # Propagate transformations of the Axes
)
ax.add_collection(collection)
ax.autoscale_view()
脚本总运行时间:(0 分 8.624 秒)