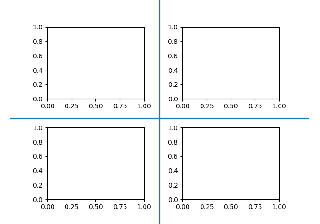
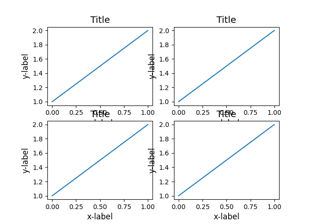
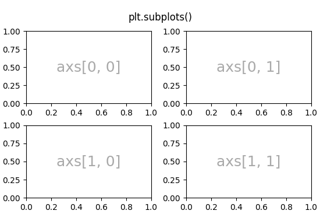
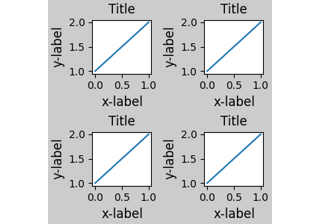
matplotlib.pyplot.subplots#
- matplotlib.pyplot.subplots(nrows=1, ncols=1, *, sharex=False, sharey=False, squeeze=True, width_ratios=None, height_ratios=None, subplot_kw=None, gridspec_kw=None, **fig_kw)[源代码]#
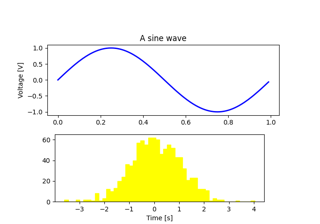
创建一个图和一组子图。
这个实用程序包装器方便地通过一次调用创建子图的常见布局,包括包含的图对象。
- 参数:
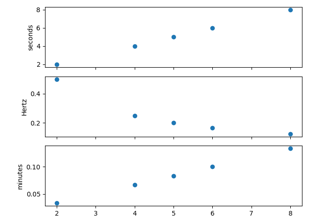
- nrows, ncols整型, 默认值: 1
子图网格的行/列数量。
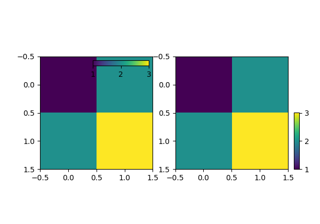
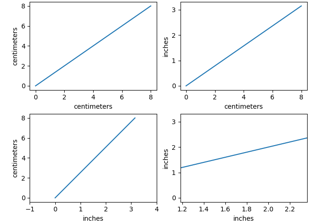
- sharex, sharey布尔型或 {'none', 'all', 'row', 'col'}, 默认值: False
控制 x 轴 (sharex) 或 y 轴 (sharey) 属性的共享
True 或 'all':x 轴或 y 轴将在所有子图之间共享。
False 或 'none':每个子图的 x 轴或 y 轴将是独立的。
'row':每个子图行将共享一个 x 轴或 y 轴。
'col':每个子图列将共享一个 x 轴或 y 轴。
当子图沿列共享 x 轴时,仅创建底部子图的 x 刻度标签。类似地,当子图沿行共享 y 轴时,仅创建第一列子图的 y 刻度标签。要稍后开启其他子图的刻度标签,请使用
tick_params。当子图具有带单位的共享轴时,调用
Axis.set_units将使用新单位更新每个轴。请注意,无法取消共享轴。
- squeeze布尔型, 默认值: True
如果为 True,则从返回的
Axes数组中压缩掉额外的维度如果只构造一个子图 (nrows=ncols=1),则结果单个 Axes 对象将作为标量返回。
对于 Nx1 或 1xM 子图,返回的对象是 Axes 对象的 1D numpy 对象数组。
对于 NxM,N>1 且 M>1 的子图将作为 2D 数组返回。
如果为 False,则不进行任何压缩:返回的 Axes 对象始终是一个包含 Axes 实例的 2D 数组,即使它最终是 1x1。
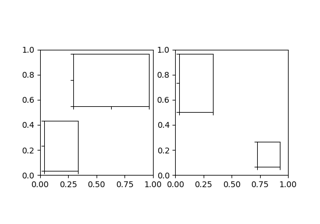
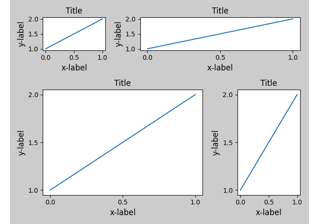
- width_ratios长度为 ncols 的类数组对象, 可选
定义列的相对宽度。每列的相对宽度为
width_ratios[i] / sum(width_ratios)。如果未给出,所有列将具有相同的宽度。等同于gridspec_kw={'width_ratios': [...]}。- height_ratios长度为 nrows 的类数组对象, 可选
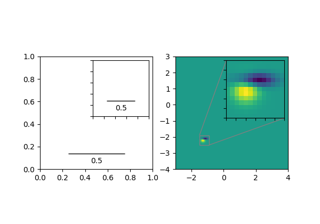
定义行的相对高度。每行的相对高度为
height_ratios[i] / sum(height_ratios)。如果未给出,所有行将具有相同的高度。方便起见,可使用gridspec_kw={'height_ratios': [...]}。- subplot_kw字典, 可选
包含传递给用于创建每个子图的
add_subplot调用的关键字的字典。- gridspec_kw字典, 可选
包含传递给用于创建子图所在网格的
GridSpec构造函数的关键字的字典。- **fig_kw
所有额外的关键字参数都传递给
pyplot.figure调用。
- 返回:
- fig
Figure - ax
Axes或 Axes 数组 ax 可以是单个
Axes对象,也可以是 Axes 对象的数组(如果创建了多个子图)。结果数组的维度可以通过 squeeze 关键字控制,详见上文。处理返回值时的典型用法是
# using the variable ax for single a Axes
fig, ax = plt.subplots()

# using the variable axs for multiple Axes
fig, axs = plt.subplots(2, 2)

# using tuple unpacking for multiple Axes
fig, (ax1, ax2) = plt.subplots(1, 2)
fig, ((ax1, ax2), (ax3, ax4)) = plt.subplots(2, 2)
名称
ax和复数形式的axs比axes更受推荐,因为对于后者,不清楚它指的是单个Axes实例还是一组这样的实例。
- fig
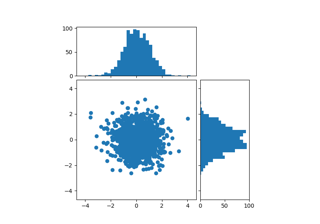
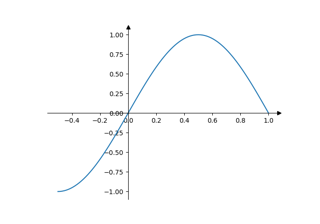
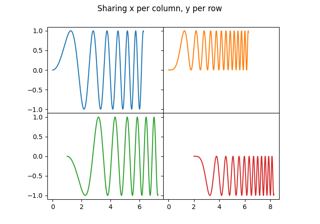
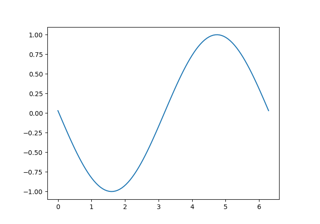
示例
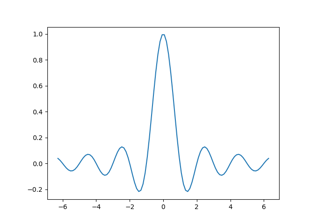
# First create some toy data:
x = np.linspace(0, 2*np.pi, 400)
y = np.sin(x**2)

# Create just a figure and only one subplot
fig, ax = plt.subplots()
ax.plot(x, y)
ax.set_title('Simple plot')

# Create two subplots and unpack the output array immediately
f, (ax1, ax2) = plt.subplots(1, 2, sharey=True)
ax1.plot(x, y)
ax1.set_title('Sharing Y axis')
ax2.scatter(x, y)

# Create four polar Axes and access them through the returned array
fig, axs = plt.subplots(2, 2, subplot_kw=dict(projection="polar"))
axs[0, 0].plot(x, y)
axs[1, 1].scatter(x, y)

# Share a X axis with each column of subplots
plt.subplots(2, 2, sharex='col')

# Share a Y axis with each row of subplots
plt.subplots(2, 2, sharey='row')

# Share both X and Y axes with all subplots
plt.subplots(2, 2, sharex='all', sharey='all')

# Note that this is the same as
plt.subplots(2, 2, sharex=True, sharey=True)

# Create figure number 10 with a single subplot
# and clears it if it already exists.
fig, ax = plt.subplots(num=10, clear=True)