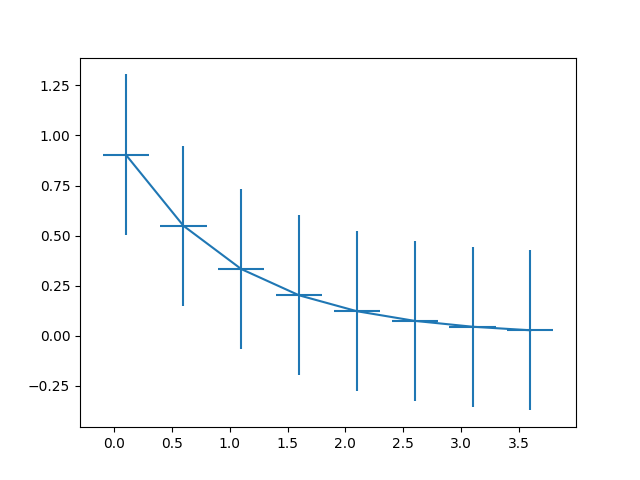
注意 前往末尾 以下载完整的示例代码。 误差条函数# 这展示了误差条方法最基本的使用方式。在此情况下,为x轴和y轴方向的误差提供了常数值。 import matplotlib.pyplot as plt import numpy as np # example data x = np.arange(0.1, 4, 0.5) y = np.exp(-x) fig, ax = plt.subplots() ax.errorbar(x, y, xerr=0.2, yerr=0.4) plt.show() 标签:图表类型: 误差条 领域: 统计 参考 本示例展示了以下函数、方法、类和模块的使用 matplotlib.axes.Axes.errorbar / matplotlib.pyplot.errorbar 由 Sphinx-Gallery 生成的画廊