注意
跳转到末尾以下载完整示例代码。
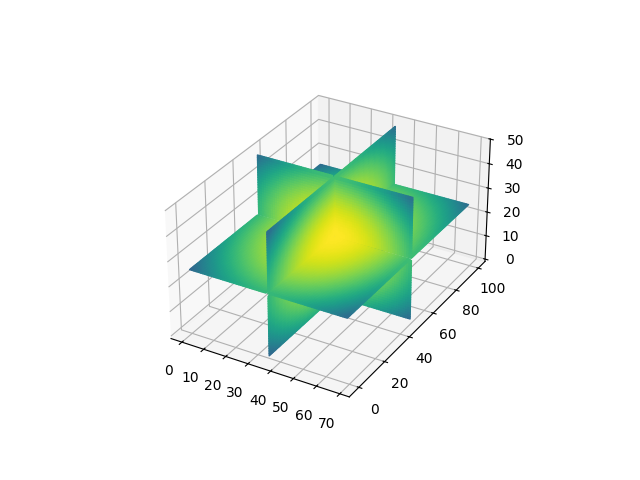
相交平面#
本示例演示了在3D中绘制相交平面。它是3D中的2D图像的推广。
在mplot3d中绘制相交平面很复杂,因为mplot3d不是一个真正的3D渲染器,它只是将Artists投影到3D中并按正确的顺序绘制它们。如果Artists相互重叠,这便无法正常工作。在本示例中,我们通过在交点处分割平面来解决相互重叠的问题,将每个平面分成四部分。
本示例仅适用于相互对半切割的平面。此限制是故意为之,旨在保持代码的可读性。当然可以在任意位置进行切割,但这会使代码更加复杂。因此,本示例更多地是演示如何解决3D可视化限制的概念,它并非一个用于绘制任意相交平面的完善解决方案,您不能直接复制粘贴使用。
import matplotlib.pyplot as plt
import numpy as np


def plot_quadrants(ax, array, fixed_coord, cmap):
    """For a given 3d *array* plot a plane with *fixed_coord*, using four quadrants."""
    nx, ny, nz = array.shape
    index = {
        'x': (nx // 2, slice(None), slice(None)),
        'y': (slice(None), ny // 2, slice(None)),
        'z': (slice(None), slice(None), nz // 2),
    }[fixed_coord]
    plane_data = array[index]

    n0, n1 = plane_data.shape
    quadrants = [
        plane_data[:n0 // 2, :n1 // 2],
        plane_data[:n0 // 2, n1 // 2:],
        plane_data[n0 // 2:, :n1 // 2],
        plane_data[n0 // 2:, n1 // 2:]
    ]

    min_val = array.min()
    max_val = array.max()

    cmap = plt.get_cmap(cmap)

    for i, quadrant in enumerate(quadrants):
        facecolors = cmap((quadrant - min_val) / (max_val - min_val))
        if fixed_coord == 'x':
            Y, Z = np.mgrid[0:ny // 2, 0:nz // 2]
            X = nx // 2 * np.ones_like(Y)
            Y_offset = (i // 2) * ny // 2
            Z_offset = (i % 2) * nz // 2
            ax.plot_surface(X, Y + Y_offset, Z + Z_offset, rstride=1, cstride=1,
                            facecolors=facecolors, shade=False)
        elif fixed_coord == 'y':
            X, Z = np.mgrid[0:nx // 2, 0:nz // 2]
            Y = ny // 2 * np.ones_like(X)
            X_offset = (i // 2) * nx // 2
            Z_offset = (i % 2) * nz // 2
            ax.plot_surface(X + X_offset, Y, Z + Z_offset, rstride=1, cstride=1,
                            facecolors=facecolors, shade=False)
        elif fixed_coord == 'z':
            X, Y = np.mgrid[0:nx // 2, 0:ny // 2]
            Z = nz // 2 * np.ones_like(X)
            X_offset = (i // 2) * nx // 2
            Y_offset = (i % 2) * ny // 2
            ax.plot_surface(X + X_offset, Y + Y_offset, Z, rstride=1, cstride=1,
                            facecolors=facecolors, shade=False)


def figure_3D_array_slices(array, cmap=None):
    """Plot a 3d array using three intersecting centered planes."""
    fig = plt.figure()
    ax = fig.add_subplot(projection='3d')
    ax.set_box_aspect(array.shape)
    plot_quadrants(ax, array, 'x', cmap=cmap)
    plot_quadrants(ax, array, 'y', cmap=cmap)
    plot_quadrants(ax, array, 'z', cmap=cmap)
    return fig, ax


nx, ny, nz = 70, 100, 50
r_square = (np.mgrid[-1:1:1j * nx, -1:1:1j * ny, -1:1:1j * nz] ** 2).sum(0)

figure_3D_array_slices(r_square, cmap='viridis_r')
plt.show()
脚本总运行时间: (0 分钟 5.861 秒)